

 UK
UK  EN
EN 



Muhammad Shabbir1
 Altaf Bandy1
Bushra Mehboob *2, 3
Usman Mahboob2
Ambreen Liaqat1
Feras Almarshad1
Siti Khadijah Adam4
Altaf Bandy1
Bushra Mehboob *2, 3
Usman Mahboob2
Ambreen Liaqat1
Feras Almarshad1
Siti Khadijah Adam4
Key words: artificial intelligence, item difficulty, item discrimination, large language models, medical education, meta-analysis, psychometrics, single best answer
Ключові слова: штучний інтелект, складність завдань, розрізнення завдань, великі мовні моделі, медична освіта, метааналіз, психометрія, єдина найкраща відповідь
Abstract
Single Best Answer Questions (SBAs) are essential and resource-intensive assessment tools in health professions education. Artificial Intelligence (AI), such as large language models (LLMs), can automate the creation of SBAs; however, evidence comparing the quality of AI-generated and human-created items is still dispersed. The purpose of the study is to compare the psychometric quality, measured by difficulty and discrimination indices, of AI-generated SBAs with those authored by humans in health professions education. The current study followed PRISMA guidelines. The search was conducted on Scopus, PubMed, and Google Scholar. Studies published through April 25th, 2025, and those that directly compared AI- and human-generated SBAs and reported the mean, standard deviation, and sample size for both difficulty and discrimination indices were included. Two reviewers independently extracted the data. Standardized mean differences (SMDs) were calculated and combined using random-effects models (Jamovi MAJOR module, version 2.6.44-06 March 2025). Heterogeneity and publication bias were assessed. Four studies met the inclusion criteria, providing eight comparison outcomes (4 for difficulty, 4 for discrimination). The combined analysis of both outcomes revealed no statistically significant difference, overall (SMD= -0.084, 95% CI: -0.65 to 0.49, p=0.773); however, the heterogeneity was very high (I²=92.7%). Separate analyses revealed that AI-generated questions were significantly easier than human-generated questions (SMD= +0.541, 95% CI: 0.17 to 0.91, p=0.004; I²=62.3%). Conversely, human-authored questions demonstrated significantly higher discrimination indices than AI-generated questions (SMD= -0.701, 95% CI: -1.33 to -0.08, p=0.028; I²=86.2%). No evidence of publication bias was found. AI-generated items tend to be easier, potentially aiding accessibility, whereas human-authored items currently exhibit superior discriminatory power, which is crucial for robust assessment. High heterogeneity underscores context dependency.
Реферат
Якість тестових завдань з однією найкращою відповіддю, згенерованих ШІ та людиною: систематичний огляд і метааналіз. Шаббір Мухаммад, Бенді Алтаф, Мехбуб Бушра, Махбуб Усман, Ліакат Амбрін, Аль-Маршад Ферас, Адам Сіті Хадіджа. Тестові завдання з єдиною найкращою відповіддю (Single Best Answer Questions, SBA) є важливими та ресурсоємними інструментами оцінювання в освіті фахівців сфери охорони здоров’я. Штучний інтелект (ШІ), зокрема великі мовні моделі (LLMs), може автоматизувати створення завдань типу SBA; однак дані щодо порівняння якості завдань, створених ШІ та людиною, наразі залишаються розрізненими. Метою дослідження було порівняти психометричну якість, виміряну за індексами складності та дискримінації, SBA, згенерованих ШІ, із завданнями, автором яких є людина, у сфері освіти медичних працівників. Дослідження виконано відповідно до рекомендацій PRISMA. Пошук літератури здійснювався в базах Scopus, PubMed та Google Scholar. До аналізу включалися дослідження, опубліковані до 25 квітня 2025 року, які безпосередньо порівнювали SBA, створені ШІ та людиною, і повідомляли середнє значення, стандартне відхилення та обсяг вибірки для індексів складності та дискримінації. Двоє рецензентів незалежно здійснювали вилучення даних. Стандартизовані середні різниці (standardized mean differences, SMDs) були розраховані та об’єднані з використанням моделей випадкових ефектів (модуль Jamovi MAJOR, версія 2.6.44-06 березня 2025 року). Також оцінювали гетерогенність та упередження публікації. Чотири дослідження відповідали критеріям включення, надавши вісім порівняльних результатів (4 для складності, 4 для дискримінації). Сукупний аналіз обох показників не виявив статистично значущої різниці загалом (SMD= -0,084; 95% ДІ: -0,65 до 0,49; p=0,773); однак гетерогенність була дуже високою (I²=92,7%). Окремі аналізи показали, що завдання, згенеровані ШІ, були статистично значуще простішими, ніж створені людьми (SMD= +0,541; 95% ДІ: 0,17-0,91; p=0,004; I²=62,3%). Водночас завдання, авторами яких були люди, демонстрували значно вищі індекси дискримінації порівняно з ШІ (SMD= -0,701; 95% ДІ: -1,33 до -0,08; p=0,028; I²=86,2%). Ознак публікаційного зміщення не виявлено. Завдання, створені ШІ, як правило, є простішими, що може підвищувати доступність оцінювання, тоді як завдання, створені людиною, наразі демонструють вищу дискримінативну здатність, що є критично важливим для надійного оцінювання. Висока гетерогенність підкреслює залежність результатів від контексту.
In the era of competency-based medical education, assessment plays a central role in guiding learning, evaluating progress, and ensuring that students attain the required competencies for clinical practice [1]. Among various assessment tools, single-best-answer (SBA) questions remain a cornerstone due to their objectivity, efficiency, and ability to cover diverse knowledge areas. When SBAs are designed around clinical scenarios, they promote critical thinking and decision-making by mimicking real-world medical situations [2, 3, 4]
However, the consistent development of high-quality SBAs is a resource-intensive process that requires subject matter expertise, psychometric sensitivity, and iterative validation. In this context, ChatGPT is considered a valuable tool for automating the generation of exam questions through generative AI [5, 6].
Recent studies have evaluated the psychometric performance and content quality of AI-generated SBAs compared to human-authored ones. While ChatGPT demonstrates efficiency and scalability in question generation, concerns remain regarding its accuracy, contextual alignment, and discriminatory ability [7, 8, 9]. Some studies report comparable item difficulty between AI- and human-generated questions [6], but consistently lower discrimination indices for AI items, which raises questions about their validity in differentiating learner performance [5].
Moreover, qualitative assessments have highlighted content-specific issues in AI-generated SBAs, such as factual inaccuracies, inappropriate difficulty levels, and culturally insensitive phrasing [10, 11]. These findings underscore the necessity of human oversight and robust quality assurance processes before AI-generated items can be integrated into high-stakes assessments [12].
The Purpose of the current systematic review and meta-analysis is to evaluate and synthesize existing evidence comparing the psychometric properties of AI-generated and human-created SBA questions in medical education contexts. Specifically, it addresses differences in item difficulty and discrimination, and examines the implications for assessment quality, validity, and utility in medical curricula. By quantitatively pooling data on these key psychometric properties where possible, we seek to provide a consolidated understanding of the relative strengths and weaknesses of current AI capabilities in SBA generation compared to traditional human authorship.
MATERIALS AND METHODS OF RESEARCH
The study was conducted as a systematic review and meta-analysis to compare the psychometric analysis of single-best-answer (SBA) questions generated by artificial intelligence (AI) with those written by human educators. The protocol included the review question, search strategy, problem description, intervention, comparison, outcome, and the end time point (PICOT), as well as inclusion criteria, types of studies to be included, data extraction, risk of bias, and strategies for evidence synthesis. The PICOT description was, Problem: Single best answer questions (SBAs) in health profession education; Intervention: SBAs generated by generative AI; Comparison: SBAs generated by faculty members; Outcome: Quality assessment of both set of questions through different psychometric parameters (discrimination and difficulty index); time frame: Studies published on the subject till 25th of April 2025 were included. The literature search was conducted from April 01, 2025, to April 25th, 2025, with an iterative process taken to get the best results.
Our focus was on two well-established item-level psychometric parameters: the "difficulty index” and the "discrimination index." These metrics are essential for evaluating the quality and effectiveness of assessment items. The difficulty index reflects the percentage of students who correctly answered a question, whereas the discrimination index assesses how well an item can distinguish between students who perform well and those who perform poorly. The Preferred Reporting Items for Systematic Reviews and Meta-Analyses (PRISMA) 2020 guidelines (https://www.prisma-statement.org/) were followed to ensure a structured, transparent, and replicable methodological approach.
A thorough literature review was conducted up to April 25, 2025, utilizing two primary electronic databases (Scopus, PubMed) and one search engine (Google Scholar). The search strategy was designed using Boolean operators and a combination of relevant keywords such as 'multiple choice questions', 'single best answer', 'AI-generated', 'ChatGPT', 'human-authored', and 'health professions education'. The references were managed by importing all citations into Rayyan AI (Rayyan: AI-Powered Systematic Review Management Platform). Duplicate entries were automatically removed. A blinded screening was carried out by two independent reviewers for title, abstract, and full-text relevance. Disagreements were settled through consensus, with a third reviewer available for arbitration if needed. Inter-rater reliability was measured using Cohen’s Kappa, which was calculated to be 0.81, signifying substantial agreement.
The inclusion criteria consisted of studies that directly compared SBA questions generated by AI models (e.g., ChatGPT) with those written by human experts. Furthermore, the studies included in the analysis had to report both difficulty and discrimination indices for questions generated by AI and humans. They also needed to provide adequate statistical data, such as the mean, standard deviation (SD), and sample size (N) for each group. Studies were excluded if they provided only qualitative evaluations, such as expert opinions, lacked detailed quantitative psychometric analysis, or were review articles, commentaries, or non-original research. Thus, only studies that offered strong, directly comparable data were included in the meta-analysis. Eligible studies had to be published in English and be accessible in full text.
To evaluate the quality of the included studies, the MERSQI instrument was used, which assesses various facets, including study design, sampling procedures, data collection, validity support, analytical approaches, and results. The studies scored from moderate to high, reflecting solid psychometric qualities and robust educational evaluations.
Two reviewers independently conducted data extraction using a standardized form. For each study, data elements extracted included author(s), year of publication, total number of items analyzed, the version of the AI model used, outcome type (difficulty or discrimination), group classification (AI vs. human), and the reported means and standard deviations of the relevant indices. Where necessary, difficulty index values presented as percentages (0 to 100) were converted to proportions (0.00 to 1.00) to ensure consistency across all studies. When standard deviations were not directly provided, they were approximated using the range-based method.: SD = (Max – Min) ÷ 4, which is commonly accepted in educational and psychometric research when only minimum and maximum values are provided.
Data Synthesis and Statistical Analysis
The MAJOR module in the Jamovi statistical software platform, version 2.6.44 for Windows (Jamovi desktop – Jamovi), was used for meta-analysis. The analysis compared the psychometric quality of AI- and human-generated SBA questions using standardized mean differences (SMDs). A separate random-effects model was applied to both the difficulty index and the discrimination index because of their distinct interpretations and psychometric significance. Additionally, a combined analysis was conducted by aggregating all available data from both parameters. The a priori selection of a random-effects model was made to address anticipated heterogeneity stemming from factors such as diverse study populations, AI models, quality of item writing, and educational disciplines.
Assessment of Heterogeneity and Publication Bias
The I² metric, Tau², and Cochran’s Q test were utilized to assess heterogeneity in results among the different studies. Additionally, 95% prediction intervals were calculated to assess the expected range of effects in future studies. In addition to mitigating the risk of publication bias, several diagnostic tools were employed. Funnel plots (Figs) were visually examined for asymmetry, and Egger’s regression test was performed to identify small-study effects. Additionally, the trim-and-fill technique was applied to estimate the potential number of unpublished studies, while the fail-safe N was computed to evaluate the stability of the findings. Influential data points and outliers were detected using studentized residuals and Cook’s distances. All outcomes are presented with 95% confidence intervals, with significance determined at p<0.05.
Risk of bias
A comprehensive evaluation of bias risk was conducted to uphold the credibility and internal validity of this meta-analysis. The Medical Education Research Study Quality Instrument (MERSQI) served as the primary tool for this purpose. MERSQI is an established and extensively utilized tool for evaluating the methodological rigor of research in medical education, focusing on six key areas: study design, sampling methods, data types, validity of evaluation tools, data analysis techniques, and results. Each domain contributes to a cumulative score ranging from 5 to 18, allowing classification of studies into low, moderate, or high methodological quality.
In this review, two reviewers independently evaluated all four studies using the MERSQI criteria. Two studies were rated as moderate quality (score =13), while the remaining two were classified as moderate to high quality (score =14). Discrepancies in ratings were resolved through consensus and, when necessary, by consulting a third reviewer.
RESULTS AND DISCUSSION
Study Inclusion and Overview
Among the 23 articles reviewed for eligibility, only four fulfilled all the inclusion criteria and were consequently included in the final meta-analysis (Fig. 1).
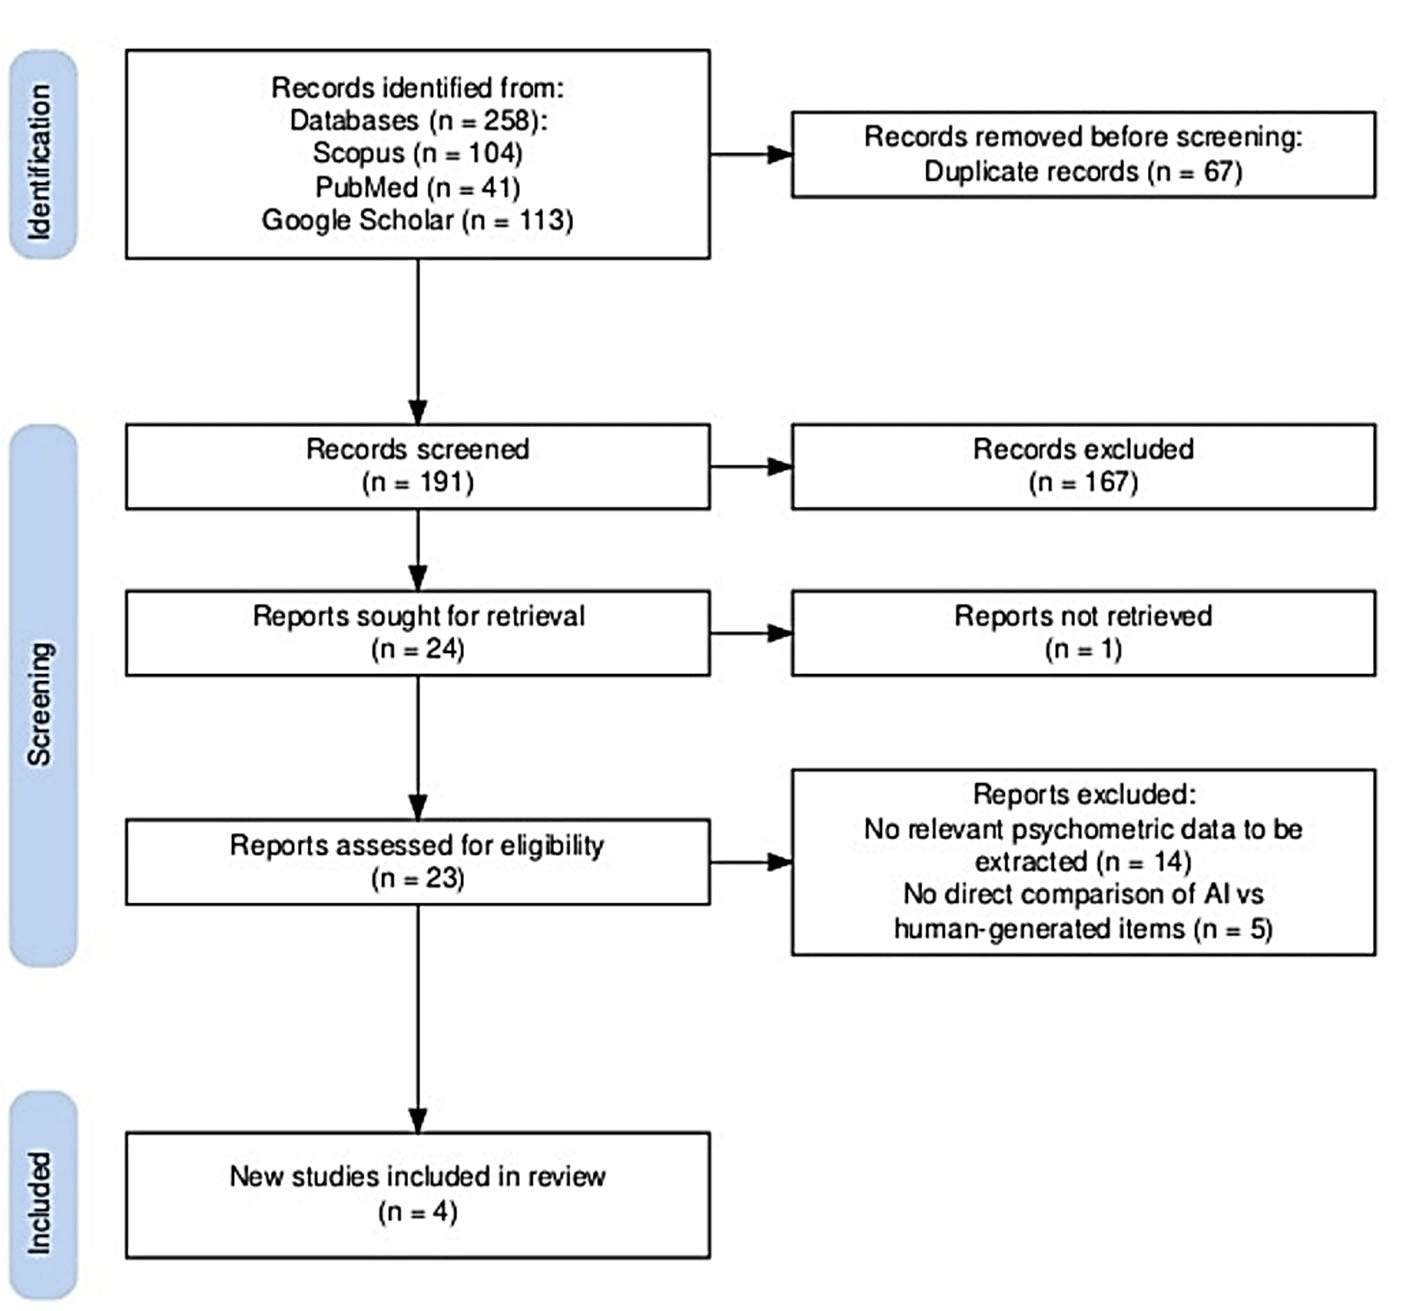
These four studies compared AI-generated and human-authored single best answer (SBA) questions in terms of two key psychometric parameters: difficulty index and discrimination index. Each study's quality was assessed using the MERSQI instrument [13]. Two of the selected studies were categorized as providing moderate to high-quality evidence. In contrast, the remaining two were classified as having a moderate level of evidence based on the MERSQI scores. Although the study mentioned different designs, the reviewers classified them as comparative quasi-experimental or crossover designs (e.g., comparing AI- vs human-generated questions). Furthermore, the study outcomes included objective psychometric parameters (e.g., difficulty index, discrimination index), which were taken into consideration in the MERSQI scoring system. Table 1 provides an overview of the characteristics of each study.
Author, year Study design Study setting Comparison AI Model Participants Outcomes Measured *Evidence level Law et al. (2025) [8] Comparative quasi-experimental or cross-over designs Hong Kong, PEEM exam (mock exam for AI authored questions followed by real exam AI vs Human-authored MCQs ChaGPT-4o Medical doctors Difficulty Index, Discrimination Index Moderate Points (13) Chauhan et al. (2025) [14] Comparative quasi-experimental or cross-over designs India, Physiology course exam (formative) AI vs Human-authored SBAs ChaGPT-4o MBBS students Difficulty Index, Discrimination Index Moderate–High Points (14) Laupichler et al. (2024) [6] Comparative quasi-experimental or cross-over designs Germany, Neurophysiology course exam (formative) AI vs Human-authored questions ChatGPT-3.5 Medical students Difficulty Index, Discrimination Index Moderate Points (13) Ahmed et al. (2025) [5] Comparative quasi-experimental or cross-over designs Scottish Graduate-Entry Medicine (ScotGEM) program (formative) AI vs Human-authored MCQs ChaGPT-4 Undergraduate medical students Difficulty Index, Discrimination Index Moderate–High Points (14) Note. * – quality of evidence determined using the MERSQI tool.
with human authored questions)
Each study reported the necessary summary statistics (mean, standard deviation, and sample size) for both AI and human groups, allowing for standardized mean difference (SMD) calculations (Table 2).
Combined Outcome Analysis
When combining all eight comparisons (across four studies and two outcomes), the overall standardized mean difference between questions generated by AI and humans was approximately –0.084 (with a 95% confidence interval ranging from -0.65 to +0.48). This result was not statistically significant (p=0.769), indicating that there was no clear overall benefit observed for either group across both outcomes (Table 3).
Estimate se Z p CI Lower Bound CI Upper Bound Intercept -0.0847 0.289 -0.293 0.769 -0.650 0.481 Tau² Estimator: Restricted Maximum-Likelihood Heterogeneity Statistics Tau Tau² I² H² R² df Q p 0.780 0.6083 (SE=0.3558) 93.01% 14.302 . 7.000 78.307 <0.001
The analysis revealed significant heterogeneity with an I² of 93.0%, reflecting differences in outcomes across various studies. The predicted range was from -1.72 to 1.55, implying that in future research, either AI-generated or human-generated questions could be deemed more effective, depending on the circumstances. No outliers were detected, and there was no evidence of publication bias, as indicated by an Egger’s test p-value of 0.685 and the trim-and-fill method not adding any studies (Fig. 2).
The heterogeneity (I²=93.0%), was further assessed by meta-regression with SMD’s of each study as the dependent variable and AI model version (GPT-3.5 vs. GPT-4 variants), Country of study (e.g., UK, India, Germany, Hong Kong) and Sample size (n) as moderator variables. The model's Residual Heterogeneity (τ²) was reduced by ~18%, indicating a partial explanation of variability, but not a complete one. The results of the regression analysis showed that none of the moderator variables had a significant impact on the observed effect sizes. However, there was a non-significant trend suggesting that questions generated by GPT-4 might have lower discrimination indices as compared to GPT-3.5 (β= -0.36, p=0.09). Country and sample size did not significantly moderate the effect size in either outcome.
The outcome measure employed in the analysis was the standardized mean difference. A random-effects model was applied to the data, with heterogeneity (τ²) estimated using the restricted maximum likelihood method. Additionally, tau², the Q-test for heterogeneity, and the I² statistic were reported. If any heterogeneity is detected (tau² >0, regardless of the Q-test results), a prediction interval for the true outcomes is provided. Studentized residuals and Cook's distances were employed to detect possible outliers and influential data points in the analysis. Outliers were defined as studies where the studentized residuals surpassed the critical value corresponding to the 100x(1-0.05/(2xk)) percentile of the standard normal distribution, with a Bonferroni adjustment to account for multiple comparisons. Influential studies were identified as those with Cook's distances exceeding the median plus six times the interquartile range across all Cook's distances. To evaluate funnel plot asymmetry, both the rank correlation test and a regression analysis were used, with the standard error of observed outcomes serving as a predictor.
The analysis involved four different studies and eight variables. The range of standardized mean differences observed was from -1.4567 to 1.1101, with approximately half of the estimates being negative. Using a random-effects model, the calculated mean standardized difference was -0.0837 with a 95% confidence interval between -0.6505 and 0.4802. This indicates that there was no significant difference from zero in the overall outcome, as reflected by a z-value of -0.2934 and a p-value of 0.7692. The Q-test suggests the presence of heterogeneity among the true effects, with a Q statistic of 78.3074 (degrees of freedom =7), p-value less than 0.0001, tau² =0.6083, I² =93.0081%. The predicted interval for true effects at 95% confidence spans from -1.7142 to 1.5452, illustrating that despite the average estimate being negative, individual studies could yield positive results. Residual analysis revealed no outliers, as none exceeded ±2.7344 in the studentized residuals. Cook's distance analysis confirmed that no studies exerted undue influence on the model. Additionally, statistical tests for funnel plot asymmetry, including the rank correlation and regression tests, showed no significant bias, with p-values of 0.3988 and 0.4936, respectively (Fig. 3).
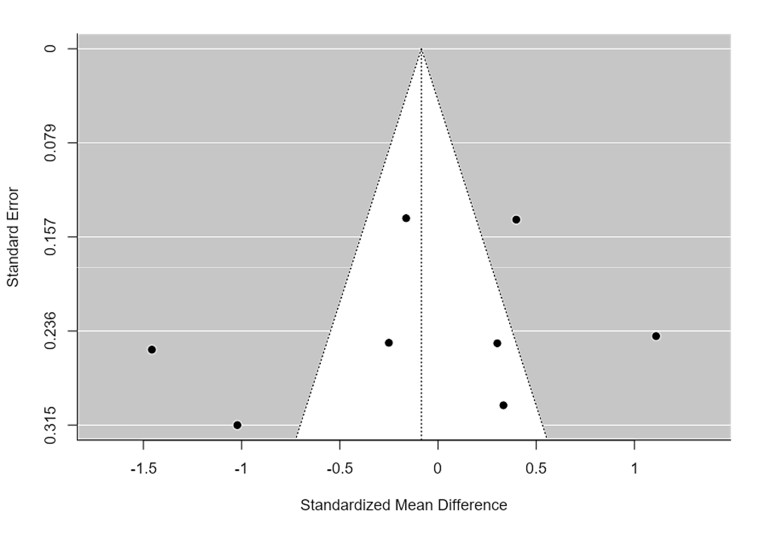
Test Name value p Fail-Safe N* 0.000 0.304 Begg and Mazumdar Rank Correlation -0.286 0.399 Egger's Regression -0.685 0.494 Trim and Fill Number of Studies 0.000 . Note. * – fail-safe N Calculation Using the Rosenthal Approach.
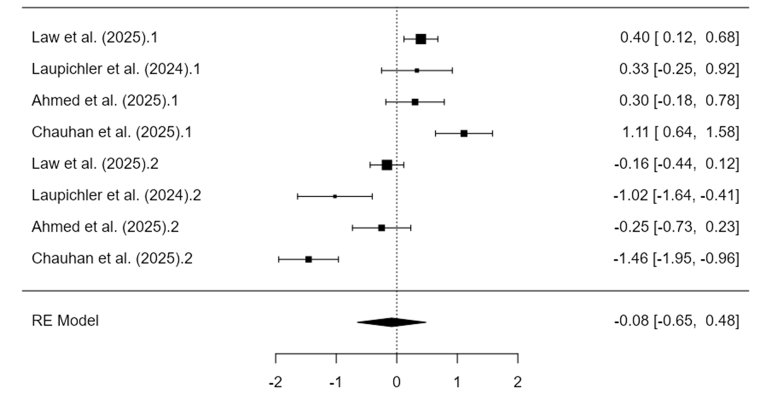
Individual outcome analysis
I. Difficulty Index
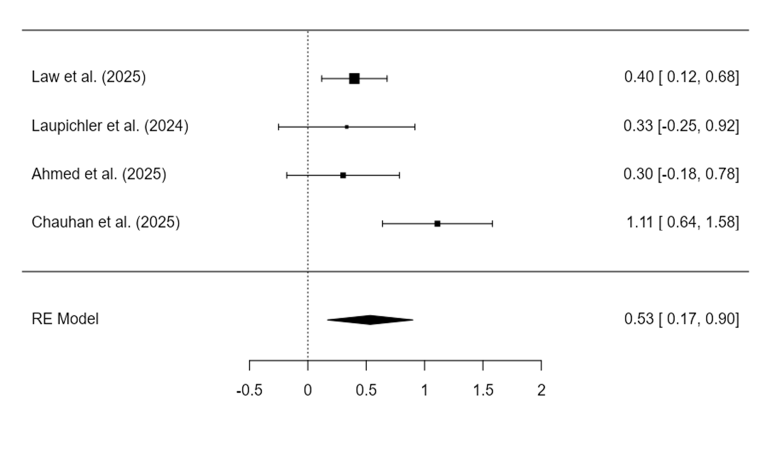
This analysis, focusing on the difficulty index (k=4), showed that questions generated by AI were significantly easier than those created by humans. The combined standardized mean difference was +0.534 (95% CI: 0.16-0.90; p=0.048), reflecting a moderate effect size that favors AI in terms of ease of use. This result exhibited moderate heterogeneity (I² =63.8%) and a prediction interval ranging from -0.15 to +1.23, suggesting that in some contexts, the difficulty level might be similar (Table 4).
According to Chauhan and colleagues' study, a potential outlier was found [14] having a studentized residual beyond the ±2 threshold; however, influence diagnostics did not suggest distortion of the overall results. No publication bias was found in this subgroup (Egger’s p=0.134) (Fig. 4).
Estimate se Z p CI Lower Bound CI Upper Bound Intercept 0.534 0.187 2.86 0.004 0.168 0.900 Random effect model (K4); Tau² Estimator: Restricted Maximum-Likelihood Heterogeneity statistics Tau Tau² I² H² R² df Q p 0.294 0.0867 (SE=0.1138 ) 63.87% 2.768 . 3.000 7.918 0.048
The study utilized the standardized mean difference to measure outcomes. A random-effects approach was employed for data analysis. The heterogeneity, represented by tau², was estimated through the restricted maximum-likelihood method. Additionally, the report presents the Q-test for heterogeneity, originally developed by Cochran in 1954, along with the I² statistic. If any heterogeneity is detected (i.e., tau² >0, regardless of the Q-test results), a prediction interval for the true outcomes is also provided. To identify potential outliers or influential studies, the analysis uses Studentized residuals and Cook's distances. In the analysis, studies are flagged as potential outliers if their Studentized residuals exceed the 100×(1-0.05/(2×k)) percentile of the standard normal distribution, with a Bonferroni correction applied at a two-sided alpha level of 0.05 to account for the total number of studies (k). Additionally, studies with Cook's distances greater than the median plus six times the interquartile range are considered to have a notable influence on the findings. To assess funnel plot symmetry, both the rank correlation test and the regression test are utilized, with the regression test incorporating the standard error of the observed outcomes as a predictor (Fig. 4).
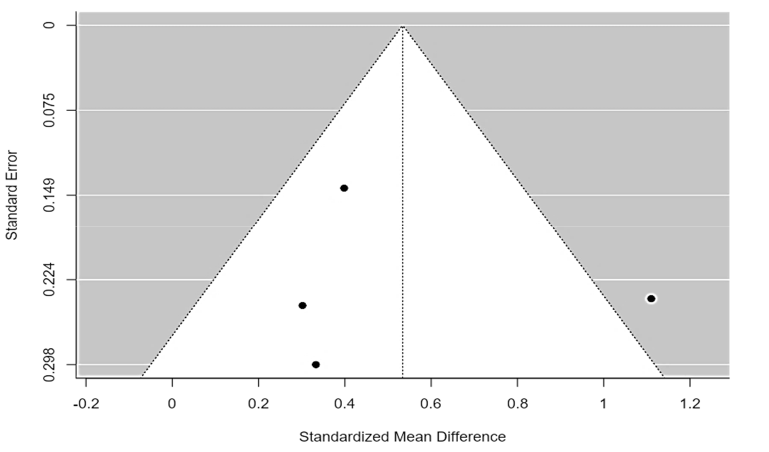
Test Name value p Fail-Safe N* 32.000 <.001 Begg and Mazumdar Rank Correlation 0.333 0.750 Egger's Regression -0.080 0.936 Trim and Fill Number of Studies 1.000 . Note. * – fail-safe N Calculation Using the Rosenthal Approach.
A total of four studies were included in the analysis. The standardized mean differences observed ranged from 0.3018 to 1.1101, with all estimates being positive (100%). The overall average standardized mean difference, calculated using a random-effects model, was approximately 0.5341, with a 95% confidence interval from 0.1685 to 0.8996. This indicates that the overall outcome significantly deviates from zero (z=2.8632, p=0.0042). The heterogeneity test using the Q statistic suggested variability among the true effects (Q(3)=7.9179, p=0.0477, tau² =0.0867, I² =63.87%). The 95% prediction interval for the true effects spans from -0.1492 to 1.2173, meaning that despite a positive average effect, individual study outcomes could fall outside or below this range. Residual analysis identified one study (Chauhan et al., 2025) [14] as a potential outlier, exceeding the threshold value of ±2.4977. Cook's distance analysis revealed no single study exerted undue influence. Tests for publication bias, including rank correlation and regression methods, did not indicate asymmetry in the funnel plot (p=0.7500 and p=0.9363, respectively) (Fig. 5).
II. Discriminatory Index Meta-Analysis
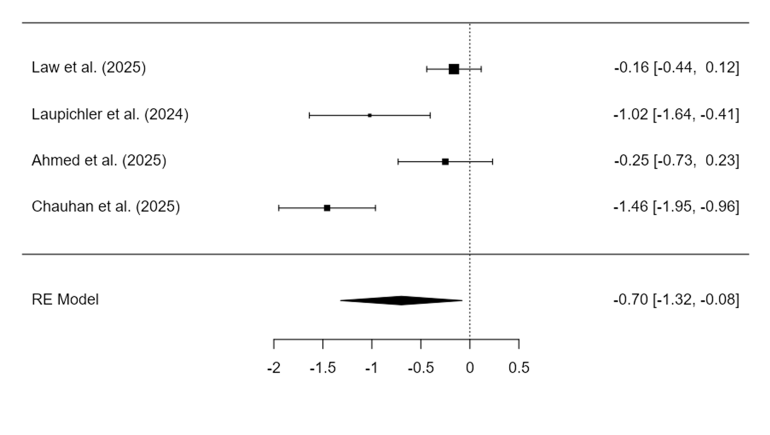
The analysis of the discrimination index (k=4) revealed that human-authored questions were significantly more discriminative than AI-generated ones. The combined standardized mean difference was -0.699, with a 95% confidence interval ranging from -1.32 to 0.07, and a p-value of 0.027. This indicates a significant effect size favoring items created by humans. This result was accompanied by high heterogeneity (I² =86.98%) and a prediction interval from -2.01 to +0.61, suggesting variability in the magnitude and direction of effect across studies (Table. 5).
The analysis revealed no outliers or overly influential studies. Additionally, funnel plot tests did not indicate any publication bias, with Egger’s test yielding a p-value of 0.383 (Fig. 6).
Estimate se Z p CI Lower Bound CI Upper Bound Intercept -0.699 0.316 -2.21 0.027 -1.320 -0.079 Random effect model (K4); Tau² Estimator: Restricted Maximum-Likelihood Heterogeneity statistics Tau Tau² I² H² R² df Q p 0.585 0.3419 (SE= 0.3271) 86.98% 7.679 . 3.000 23.928 <0.001
In the analysis, the outcome measure selected was the standardized mean difference. The data were analyzed using a random-effects model, with heterogeneity (tau²) estimated via the restricted maximum-likelihood approach. The report presents the tau² estimate, the Q-test for heterogeneity, and the I² statistic. When heterogeneity is detected (tau² >0), a prediction interval for the true effects is also provided, regardless of the Q-test outcome. To identify outliers and influential studies, studentized residuals and Cook's distances were calculated. A study is considered a potential outlier if its studentized residual surpasses the percentile corresponding to 100×(1-0.05/(2×k)) of a standard normal distribution, applying a Bonferroni correction with a two-sided alpha of 0.05 based on the total number of studies (k) included. Studies with Cook's distance exceeding the median plus six times the interquartile range are classified as influential. The assessment of funnel plot asymmetry involved both the rank correlation test and the regression test, with the latter estimating asymmetry based on the standard error of the outcomes.
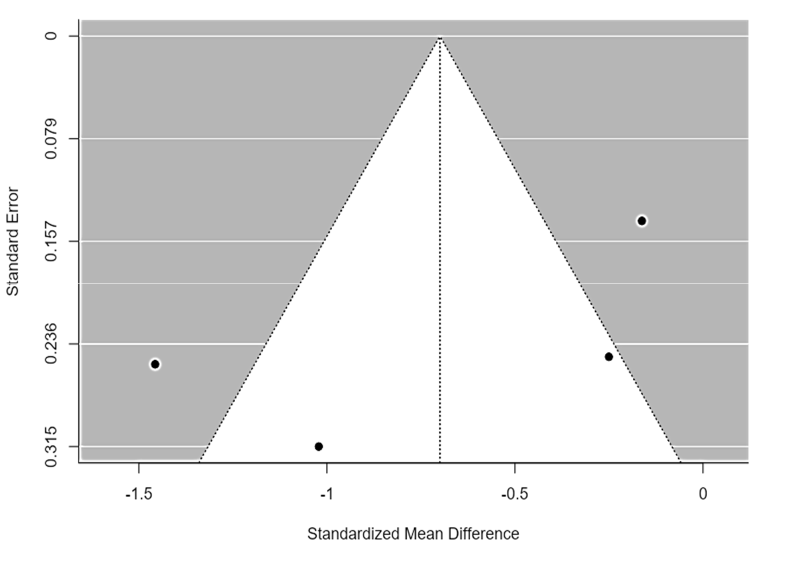
Test Name value p Fail-Safe N* 43.000 <0.001 Begg and Mazumdar Rank Correlation -0.667 0.333 Egger's Regression -1.154 0.249 Trim and Fill Number of Studies 0.000 . Note. * – fail-safe N Calculation Using the Rosenthal Approach.
In a review of four studies, the standardized mean differences ranged from -1.4567 to -0.1623, with all estimates being negative, accounting for 100% of the cases. The average standardized mean difference, estimated using a random-effects model, was -0.6994 with a 95% confidence interval of
-1.3196 to -0.0791 (Fig. 7). This indicates a significant deviation from zero (z= -2.2100, p=0.0271). Heterogeneity among the true effect sizes was confirmed by the Q-test (Q(3) =23.9276, p<0.0001, tau² =0.3419, I² =86.9772%). A 95% prediction interval suggested that the true effects could range from -2.0024 to 0.6037, implying that while the average effect is negative, some individual studies might observe positive outcomes. Residual analysis showed no outliers, as none exceeded the threshold of ±2.4977, and Cook's distances indicated no studies were disproportionately influential. Tests for publication bias, including both rank correlation and regression methods, yielded p-values of 0.3333 and 0.2487 respectively, suggesting no evidence of funnel plot asymmetry.
Overview of Findings
This meta-analysis critically evaluated the psychometric quality of single-best-answer (SBA) questions generated by artificial intelligence (AI) versus those authored by human experts in health professions education. The study is based on the difficulty and discrimination indices, providing data-driven insights into the comparability and potential applications of AI-generated assessments.
The analysis collectively showed no meaningful statistical difference between outputs created by artificial intelligence and those produced by humans, with a pooled standardized mean difference (SMD) of -0.084 (95% CI: -0.65 to 0.48), which was not statistically significant (p=0.769). However, the result must be interpreted considering the very high heterogeneity observed (I² =93.0%). Such variability suggests substantial differences in item construction methodologies, AI model versions, prompting techniques, or educational domains across studies. The wide prediction interval (-1.72 to +1.55) further emphasizes that the comparative effectiveness of AI versus human-authored questions is context-sensitive.
AI advantage in item difficulty
With regards to ease of answering questions, it was found that questions generated by using AI were significantly easier than human-authored ones (SMD=+0.534 (95% CI: 0.16-0.90; p=0.048)). Prior studies [15, 16, 17] suggest that AI tools like ChatGPT tend to construct items with simpler syntax and fewer ambiguities. Such linguistic clarity can reduce construct-irrelevant variance, thereby enhancing fairness, particularly for non-native English speakers [18].
Easier questions may also facilitate learning, particularly in formative assessments and early stages of training. Moreover, in high-stakes assessments, difficulty is not inherently valuable unless it is coupled with appropriate discrimination [19, 20]. Therefore, the utility of AI-generated questions should not be dismissed simply because they are easier. Rather, they could support scaffolding strategies in assessment design where foundational knowledge precedes more complex testing.
Human Superiority in Discrimination
Human-authored questions showed significantly higher discrimination indices than AI-generated ones (SMD= -0.699 (95% CI: -1.32 - 0.07; p=0.027), indicating a better ability to differentiate among high- and low-performing examinees. This is a well-documented advantage, supported by studies that show expert-written items to integrate clinical judgment, pedagogical intent, and cognitive load management more effectively.
The lower discrimination of AI-generated items could stem from several factors. First, AI lacks the contextual experience to generate refined distractors. Second, many studies did not specify prompts targeting higher-order cognitive domains. Third, without alignment to curriculum outcomes, AI may generate fact-based recall items that are less effective in evaluating deeper understanding. These limitations can be mitigated through prompt engineering, AI fine-tuning, and structured human-AI collaboration models.
Heterogeneity and Its Implications
High heterogeneity in the combined and discrimination outcomes (I² >85%) suggests inconsistency in study methods, question topics, and analytical approaches. Some studies relied on simulated assessments, while others used real student performance data; some utilized GPT-3.5, while others employed GPT-4 or hybrid prompts. This diversity reflects both the evolving nature of AI tools and the varied ways in which they are deployed in educational settings.
This heterogeneity (I² =93.01%), was further assessed by meta-regression with SMD’s of each study as the dependent variable and AI model version (GPT-3.5 vs. GPT-4 variants), Country of study (e.g., UK, India, Germany, Hong Kong) and Sample size (n) as moderator variables. The model Residual Heterogeneity (τ²): reduced by ~18%, indicating partial explanation of variability, but not complete. The analysis of the regression results indicated that none of the moderator variables significantly influenced the observed outcome. However, the AI model version revealed a non-significant trend, suggesting that GPT-4-generated questions may exhibit lower discrimination indices compared to GPT-3.5 (β= -0.36, p=0.09). Country and sample size did not significantly moderate the effect size in either outcome. These findings suggest that heterogeneity may stem from unmeasured factors such as prompt design, educational context, domain specificity, or question vetting processes. Future studies should standardize these parameters to facilitate clearer interpretation and reduce unexplained variance (Supp. 2).
Rather than undermining the analysis, this heterogeneity highlights a key strength: it reflects real-world variability. Meta-analyses that synthesize such diverse evidence provide stakeholders with a better understanding of the potential range of outcomes across various use cases. Future studies should strive to standardize psychometric reporting and stratify results by AI version, domain, and prompt quality.
Educational Implications
Contrary to the view that AI-generated questions are not suitable for high-stakes exams, the findings suggest that their current limitations lie in discrimination rather than difficulty or content accuracy. Provided that AI-generated items are reviewed and modified by experts, they can be effectively integrated into high-stakes assessments. In fact, some AI-generated items in included studies met or exceeded standard psychometric thresholds [8, 14].
Moreover, AI tools offer scalability, consistency, and speed in item generation – qualities that are highly valuable in large-scale assessments. With proper training datasets and expert oversight, AI could evolve into a reliable source for high-quality questions. Therefore, the current findings support a hybrid assessment model where AI serves as a productive starting point and human experts refine and validate the output.
Limitations
The limitations include a small number of included studies (four), which reduces the statistical power and generalizability of the results. Significant heterogeneity was observed, particularly for the discrimination index (I² >85%), indicating substantial variability across different study contexts, AI models, and prompting techniques that could not be fully explored with meta-regression. Furthermore, the rapid evolution of AI technology means these findings reflect the capabilities of models used in the included studies, which may differ from the most current versions.
Future Directions
Based on the findings and limitations identified in this review, future research should prioritize several key areas. Firstly, systematic investigations are needed to determine how variations in AI models (e.g., GPT-4 vs. specialized models), prompt engineering strategies targeting specific cognitive levels (like Bloom's taxonomy), and subject matter domains influence the psychometric quality, particularly the discrimination index, of generated SBAs. Secondly, research should focus on developing and rigorously evaluating hybrid human-AI co-authorship workflows, assessing their impact on efficiency, item quality, and the mitigation of AI weaknesses, such as poor distractor generation. Finally, studies exploring the effectiveness of fine-tuning large language models specifically on high-quality assessment item data could lead to AI tools intrinsically better suited for creating psychometrically sound questions.
CONCLUSION
While the combined analysis pooling difficulty and discrimination outcomes yielded no statistically significant overall difference, this result is overshadowed by substantial heterogeneity and masks crucial distinctions revealed in separate analyses.
- Our findings show a clear advantage for Artificial intelligence in terms of item difficulty, as Artificial intelligence generated questions tend to be easier than those created by humans. This may be due to simpler syntax or less ambiguous wording, which could improve fairness or usefulness in formative assessments. However, human expertise still has a significant lead in item discrimination, indicating a better ability to tell apart high- and low-performing examinees. This advantage likely stems from pedagogical experience, clinical judgment, and the ability to create more nuanced and plausible distractors, which are crucial for the validity of high-stakes tests.
- While Artificial intelligence generated SBAs demonstrate potential, particularly in terms of ease and scalability, human-crafted items currently offer greater psychometric robustness, especially in terms of discrimination. The findings support the integration of Artificial intelligence into assessment workflows, not as a replacement for human authors, but as a potentially powerful assistant. A hybrid model, where Artificial intelligence generates initial drafts that are subsequently reviewed, refined, and validated by subject matter experts, appears to be the most promising approach. Future efforts should focus on optimizing Artificial intelligence generation through targeted prompt engineering, model fine-tuning based on psychometric principles, and establishing standardized reporting practices to facilitate more robust comparisons. Ultimately, the integration of Artificial intelligence into assessment must be guided by rigorous psychometric validation, domain relevance considerations, and collaborative human – Artificial intelligence review processes to ensure the continued integrity and validity of educational assessments. The following key points are highlighted by the study:
- creating high-quality single-best-answer questions in medical education is a resource-intensive process.
- while Artificial intelligence generated questions are easier and useful for formative assessments, human-written questions have higher discrimination, making them better for high-stakes exams.
- results vary widely due to factors such as Artificial intelligence version and setting, highlighting the need for standardization and human oversight.
Acknowledgement. The authors thank the Deanship of Scientific Research (DSR) at Shaqra University for their continuous research support.
Contributors:
Shabbir Muhammad – conceptualization, data curation, formal analysis, investigation, methodology, resources, software, validation, visualization, writing – original draft, writing – review and editing.
Bandy Altaf – conceptualization, data curation, formal analysis, investigation, methodology, writing – original draft.
Mehboob Bushra – conceptualization, data curation, formal analysis, investigation, methodology, visualization, writing – original draft, writing – review and editing.
Mahboob Usman – methodology, project administration, resources, supervision, writing – review and editing.
Liaqat Ambreen – formal analysis, data curation, reviewed the manuscript.
Almarshad Feras – formal analysis, data curation, reviewed the manuscript.
Adam Siti Khadijah – supervision, validation, writing – review and editing.
Funding. This research received no external funding.
Conflict of interests. The authors declare no conflict of interest.
REFERENCES
- Ibarra-Sáiz MS, Rodríguez-Gómez G, Boud D. The quality of assessment tasks as a determinant of learning. Assess Eval High Educ. 2021 Aug 18;46(6):943-55. doi: https://doi.org/10.1080/02602938.2020.1828268
- Coughlin PA, Featherstone CR. How to write a high quality multiple choice question (MCQ): a guide for clinicians. European Journal of Vascular and Endovascular Surgery. 2017 Nov;54(5):654-8. doi: https://doi.org/10.1016/j.ejvs.2017.07.012
- Badyal DK, Jain A, Lata H, Sharma M. Triple Cs of scenario-based multiple-choice question: concept, construction, and corroboration. Natl J Pharmacol Ther. 2023;1:8-12. doi: https://doi.org/10.4103/NJPT.NJPT_16_23
- Bassett MH. Teaching critical thinking without (Much) writing: multiple‐choice and metacognition. Teaching Theology & Religion. 2016 Jan 5;19(1):20-40. doi: https://doi.org/10.1111/teth.12318
- Ahmed A, Kerr E, O’malleyA. Quality assurance and validity of AI-generated single best answer questions. BMCMed 2025;25(1):300. doi: https://doi.org/10.1186/s12909-025-06881-w
- Laupichler MC, Rother JF, Grunwald Kadow IC, Ahmadi S, Raupach T. Large language models in medical education: comparing ChatGPT- to Human-Generated Exam Questions. Academic Medicine. 2024 May;99(5):508-12. doi: https://doi.org/10.1097/ACM.0000000000005626
- Zuckerman M, Flood R, Tan RJB, Kelp N, Ecker DJ, Menke J, et al. ChatGPT for assessment writing. Med Teach. 2023 Nov 2;45(11):1224-7. doi: https://doi.org/10.1080/0142159X.2023.2249239
- Law AK, So J, Lui CT, Choi YF, Cheung KH, Kei-ching Hung K, et al. AI versus human-generated multiple-choice questions for medical education: a cohort study in a high-stakes examination. BMC Med Educ. 2025 Feb 8;25(1):208. doi: https://doi.org/10.1186/s12909-025-06796-6
- Cheung BHH, Lau GKK, Wong GTC, Lee EYP, Kulkarni D, Seow CS, et al. ChatGPT versus human in generating medical graduate exam multiple choice questions – A multinational prospective study (Hong Kong S.A.R., Singapore, Ireland, and the United Kingdom). PLoS One. 2023 Aug 29;18(8):e0290691. doi: https://doi.org/10.1371/journal.pone.0290691
- Klang E, Portugez S, Gross R, Kassif Lerner R, Brenner A, Gilboa M, et al. Advantages and pitfalls in utilizing artificial intelligence for crafting medical examinations: a medical education pilot study with GPT-4. BMCMed 2023 Oct 17;23(1):772. doi: https://doi.org/10.1186/s12909-023-04752-w
- Ferrara E. Should ChatGPT be biased? challenges and risks of bias in large language models. 2023;28(11). doi: https://doi.org/10.5210/fm.v28i11.13346
- Gierl M, Swygert K, Matovinovic D, Kulesher A, Lai H. Three sources of validation evidence needed to evaluate the quality of generated test items for medical licensure. Teach Learn Med. 2024;14;36(1):72-82. doi: https://doi.org/10.1080/10401334.2022.2119569
- Reed DA, Cook DA, Beckman TJ, Levine RB, Kern DE, Wright SM. Association between funding and quality of published medical education research. JAMA. 2007 Sep 5;298(9):1002. doi: https://doi.org/10.1001/jama.298.9.1002
- Chauhan A, Khaliq F, Nayak KR. Title: assessing quality of scenario-based multiple-choice questions in physiology: faculty-generated vs. ChatGPT-Generated questions among phase I medical students. Int J Artif Intell Educ. 2025 Apr 07;35:2315-44. doi: https://doi.org/10.1007/s40593-025-00471-z
- Kung TH, Cheatham M, Medenilla A, Sillos C, De Leon L, Elepaño C, et al. Performance of ChatGPT on USMLE: potential for AI-assisted medical education using large language models. PLOS Digital Health. 2023 Feb 9;2(2):e0000198. doi: https://doi.org/10.1371/journal.pdig.0000198
- Emekli E, Karahan BN. AI in radiography education: evaluating multiple-choice questions difficulty and discrimination. J Med Imaging Radiat Sci. 2025 Jul;56(4):101896. doi: https://doi.org/10.1016/j.jmir.2025.101896
- Rezigalla AA, Eleragi AMESA, Elhussein AB, Alfaifi J, ALGhamdi MA, Al Ameer AY, et al. Item analysis: the impact of distractor efficiency on the difficulty index and discrimination power of multiple-choice items. BMC Med Educ. 2024 Apr 24;24(1):445. doi: https://doi.org/10.1186/s12909-024-05433-y
- Rodriguez MC. Three options are optimal for multiple‐choice items: a meta‐analysis of 80 years of research. Educational Measurement: Issues and Practice. 2005 Jun 9;24(2):3-13. doi: https://doi.org/10.1111/j.1745-3992.2005.00006.x
- Downing SM. The effects of violating standard item writing principles on tests and students: the consequences of using flawed test items on achievement examinations in medical education. Advances in Health Sciences Education. 2005 Jun;10(2):133-43. doi: https://doi.org/10.1007/s10459-004-4019-5
- Magzoub ME, Zafar I, Munshi F, Shersad F. Ten tips to harnessing generative AI for high-quality MCQS in medical education assessment. PubMed. 2025;30(1):2532682. doi: https://doi.org/10.1080/10872981.2025.2532682