
 UK
UK  EN
EN 

Borovyk K.M. *
![]() Kravchun P.G.
Kravchun P.G.
![]() Kadykova O.I.
Kadykova O.I.
![]() Babadzhan V.D.
Babadzhan V.D.
![]()
Key words: chronic heart failure, coronary artery disease, type 2 diabetes mellitus, obesity, lipid metabolism, GAS6
Ключові слова: хронічна серцева недостатність, ішемічна хвороба серця, цукровий діабет 2 типу, ожиріння, ліпідний обмін, GAS6
Abstract
Chronic heart failure (CHF) remains a critical problem, the relevance of which is growing against the background of cardiometabolic polymorbidity. Comorbid conditions such as type 2 diabetes mellitus (T2DM) and obesity have common pathogenetic mechanisms that accelerate myocardial remodelling and fibrosis. The GAS6 (Growth Arrest-Specific 6) protein, as a ligand for the TAM family of receptors, is a central regulator of inflammation, cell survival, and vascular remodelling. Establishing a link between GAS6 levels and specific lipid metabolism disorders in the context of CHF is critical for improving risk stratification. The aim of the study was to investigate the activity of GAS6 protein and its relationship with lipid metabolism indicators in patients with ischaemic CHF, as well as to determine its potential prognostic value for risk stratification depending on the presence of concomitant metabolic pathology. The study included 225 patients with ischemic CHF and 30 healthy individuals (control group). The patients were divided into 4 groups: Group 1 (n=75) – coronary artery disease (CAD) + T2DM + obesity; Group 2 (n=50) – CAD + T2DM; Group 3 (n=50) – CAD + obesity; Group 4 (n=50) – CAD without metabolic pathology. Lipid metabolism indicators (total cholesterol (TC), triglycerides (TG), high-density lipoprotein cholesterol (HDL-C), low-density lipoprotein cholesterol (LDL-C), very low-density lipoprotein cholesterol (VLDL-C), atherogenicity coefficient (AC)) and serum GAS6 levels (using the ELISA kit Cusabio, USA) were determined. Spearman's rank correlation coefficient was used to determine correlations, with a critical significance level of p<0.05. According to the results of the study, the GAS6 protein content was highest in Group 1 (31.64±18.71 ng/ml), exceeding the control values by 66.3% (p<0.001), which indicates the cumulative effect of combined pathology. GAS6 levels in Group 3 and Group 2 were significantly higher than the control (by 41.8% and 31.1% , respectively). When analysing the correlations in Group 1, strong and significant positive correlations were found between GAS6 and BMI (r=0.68) and proatherogenic lipid metabolism fractions (LDL-C (r=0.54), VLDL-C (r=0.51), TG (r=0.47)). GAS6 is a sensitive marker, the activation of which is closely associated with the number and type of concomitant metabolic disorders. The established strong direct relationship between GAS6 and BMI and proatherogenic lipid fractions confirms that this protein is a powerful biochemical mediator that reflects the degree of dyslipidaemia and exacerbates atherosclerosis processes in patients with cardiometabolic polymorbidity. The level of GAS6 can serve as an important diagnostic and prognostic marker for early stratification of patients with ischaemic heart failure.
Реферат
Білок GAS6 та дисфункція ліпідного обміну: потенційний біомаркер стратифікації ризику в пацієнтів з ішемічною хронічною серцевою недостатністю та метаболічними порушеннями. Боровик К.М., Кравчун П.Г., Кадикова О.І., Бабаджан В.Д. Хронічна серцева недостатність (ХСН) залишається критичною проблемою, актуальність якої зростає на тлі кардіометаболічної поліморбідності. Коморбідні стани у вигляді цукрового діабету (ЦД) 2 типу та ожиріння мають спільні патогенетичні механізми, що прискорюють ремоделювання міокарда та фіброз. Білок GAS6 (Growth Arrest-Specific 6), як ліганд рецепторів сімейства TAM (Tyro3, Axl, MerTK), є центральним регулятором запалення, клітинного виживання та судинного ремоделювання. Встановлення зв'язку між рівнем GAS6 та специфічними порушеннями ліпідного обміну на тлі ХСН є критично важливим для покращення стратифікації ризику. Метою дослідження стало дослідити активність білка GAS6 та його взаємозв'язок з показниками ліпідного обміну в пацієнтів з хронічною серцевою недостатністю ішемічного генезу, а також визначити його потенційне прогностичне значення для стратифікації ризику залежно від наявності супутньої метаболічної патології. Дослідження охопило 225 хворих з ХСН ішемічного генезу та 30 здорових осіб (контрольна група). Хворі були розподілені на 4 групи: група 1 (n=75) – ІХС + ЦД 2 типу + ожиріння; група 2 (n=50) – ІХС + ЦД 2; група 3 (n=50) – ІХС + ожиріння; група 4 (n=50) – ІХС без метаболічної патології. Проводили визначення показників ліпідного обміну (загальний холестерин (ЗХС), тригліцериди (ТГ), холестерин ліпопротеїнів високої щільності (ХС ЛПВЩ), холестерин ліпопротеїнів низької щільності (ХС ЛПНЩ), холестерин ліпопротеїнів дуже низької щільності (ХС ЛПДНЩ), коефіцієнт атерогенності (КА)) та сироваткового рівня GAS6 (імуноферментним методом, «Cusabio», США). Для встановлення потенційного прогностичного значення GAS6 та стратифікації ризику було використано кореляційний аналіз Спірмена при критичному рівні значущості p<0,05 та ROC-аналіз. За результатами проведеного дослідження вміст білка GAS6 був найвищим у групі 1 (31,64±18,71 нг/мл), перевищуючи показники контролю на 66,3% (p<0,001), що свідчить про кумулятивний вплив поєднаної патології. Рівні GAS6 у групі 3 та групі 2 були достовірно вищими за контроль (на 41,8% та 31,1% відповідно). При аналізі кореляційних зв'язків у групі 1 виявлено сильні та достовірні позитивні кореляції GAS6 з індексом маси тіла (ІМТ) (r=0,68) та проатерогенними фракціями ліпідного обміну (ХС ЛПНЩ (r=0,54), ХС ЛПДНЩ (r=0,51), ТГ (r=0,47)). GAS6 є чутливим маркером, активація якого тісно асоційована з кількістю та типом супутніх метаболічних порушень. Установлений сильний прямий зв'язок GAS6 з ІМТ та проатерогенними фракціями ліпідів підтверджує, що цей білок є потужним біохімічним посередником, який відображає ступінь дисліпідемії та посилює процеси атеросклерозу у хворих з кардіометаболічною поліморбідністю. Рівень GAS6 може слугувати важливим діагностично-прогностичним маркером для ранньої стратифікації пацієнтів з хронічною серцевою недостатністю ішемічного генезу.
Chronic heart failure (CHF) remains one of the most pressing problems in modern cardiology and healthcare, reaching pandemic proportions and affecting more than 64 million people worldwide [1]. The most common form is ischaemic CHF, which develops as a result of coronary artery disease (CAD). Epidemiological data show that CHF is associated with high mortality and rehospitalisation rates, and its economic burden is extremely high [2].
It is well known that lipid metabolism dysfunction, in particular dyslipidaemia, is not only a cause of CAD, but also aggravates the course of existing CHF, exacerbating inflammation, myocardial remodelling and cardiovascular damage [3]. Thus, identifying new links in the cardiometabolic connection is critical for improving risk stratification and developing targeted therapies.
The GAS6 (Growth Arrest-Specific 6) protein is a vitamin K-dependent ligand of the TAM (Tyro3, Axl, MerTK) receptor family and is widely expressed in the body, localizing in particular in intestinal cells, bone marrow, fibroblasts and endothelial cells [4]. The functional spectrum of the GAS6 protein covers a number of critical biological processes, acting as a central regulator of cell survival, proliferation, inflammation, and immune regulation [5, 6, 7]. Elevated levels of GAS6 have been detected in both acute coronary syndrome [8] and CHF, indicating its involvement in vascular and myocardial remodelling processes [9].
Currently there are discrepancies regarding the role of GAS6 in the cardiometabolic continuum, and the relationship between GAS6 levels and specific lipid metabolism disorders in the context of CHF remains poorly understood, especially in the context of concomitant metabolic pathology.
The aim was to investigate the activity of the GAS6 protein and its relationship with lipid metabolism indicators in patients with ischaemic сhronic heart failure, as well as to determine its potential prognostic value for risk stratification depending on the presence of concomitant metabolic disorders (type 2 diabetes mellitus and/or obesity).
MATERIALS AND METHODS OF RESEARCH
The research involved 225 hospitalized individuals receiving cardiac care at Kharkiv City Hospital No. 27. These participants were stratified into four cohorts to evaluate the impact of metabolic comorbidities on CHF. The first cohort (n=75) consisted of patients suffering from CHF and CAD complicated by both T2DM and obesity. The second and third cohorts (n=50 each) focused on CHF patients with either T2DM or obesity alone, respectively. A comparison group (Group 4, n=50) – patients with CHF and CAD but without metabolic disturbances. Additionally, a baseline was provided by a control group of 30 healthy volunteers. Statistical analysis confirmed the demographic homogeneity of the groups, particularly regarding mean age (63.44±17.84, 64.47±13.29, 60.59±17.18, and 63.27±12.16 years, respectively; p>0.05). The distribution of patients by gender was comparable across all study groups (χ²=1.84, p=0.61). In Group 1, there were 42 men (56.0%) and 33 women (44.0%); in Group 2 – 27 men (54.0%) and 23 women (46.0%); in Group 3 – 22 men (44.0%) and 28 women (56.0%); in Group 4 – 26 men (52.0%) and 24 women (48.0%). Comparison was performed using Pearson’s chi-square test.
In order to ensure scientific reliability and avoid systematic selection bias, the clinical groups formed were comparable in terms of key characteristics of heart failure. All groups were dominated by patients with HF stage II A (72% to 82% depending on the group) and NYHA functional class II (72.0%-84.0%), which allowed the sample to be standardized according to the severity of haemodynamic disorders. The comparability of the groups in terms of the main study objective was also confirmed by a unified approach to pharmacotherapy: all patients received basic treatment in accordance with the current protocols of the Ministry of Health of Ukraine and the ESC guidelines (2024). The use of quadruple therapy, which included sodium-dependent glucose co-transporter-2 inhibitors (100% of patients in all groups), β-blockers (97.3–100%), statins and antiplatelet agents (100%), ensured a uniform therapeutic background. This made it possible to neutralise the impact of differences in treatment on the study results and to identify concomitant T2DM and obesity as the main independent factors influencing changes in regulatory biomarkers.
The verification of CAD was performed in compliance with current international and domestic guidelines, specifically the European Society of Cardiology (ESC) standards and the Unified Clinical Protocol of the Ministry of Health of Ukraine "Stable Coronary Artery Disease" (Order No. 2857, dated December 23, 2021). The diagnosis of CHF followed the classification established by the Working Group on Cardiac Insufficiency of the Association of Cardiologists of Ukraine, with functional class (FC) determination based on the NYHA (New York Heart Association) system. T2DM was identified according to the Unified Clinical Protocol of the Ministry of Health of Ukraine "Diabetes Mellitus" (Order No. 1300, dated July 24, 2024). Abdominal obesity was assessed via anthropometric measurements, including waist and hip circumferences and the body mass index (BMI), the latter calculated as:

where
BMI – body mass index (kg/m2 );
m – body weight (kg);
h – height (m).
Potential participants were eligible if they were over 18 years of age, had CAD with clinical signs of CHF (with or without accompanying metabolic disorders such as T2DM and grade 1-3 obesity), and provided informed written consent. To ensure the integrity of biomarker assessment and cardiometabolic data, the study excluded pregnant women, individuals with acute infections, autoimmune disorders, or oncological conditions. Patients with hypothalamic-pituitary axis diseases, chronic kidney disease (GFR<35 mL/min/1.73 m²), or symptomatic hypertension were also excluded. Furthermore, the exclusion criteria covered patients who had experienced acute coronary syndrome or cerebrovascular events within the preceding six months, those with acute or exacerbated inflammatory conditions, and individuals with a history of psychiatric disorders or substance abuse. Non-citizens of Ukraine and patients unlikely to follow the research protocol were not enrolled.
Lipid profile evaluation, including total cholesterol (TC) and high-density lipoprotein cholesterol (HDL-C), was conducted using the peroxidase technique with Cholesterol Liquicolor reagents (Human, Germany) in heparin-stabilized serum. Triglyceride (TG) concentrations were measured via an enzymatic colorimetric method (Triglycerides 105 GPO, Human, Germany). The atherogenic coefficient (AC), very low-density lipoprotein cholesterol (VLDL-C), and low-density lipoprotein cholesterol (LDL-C) were calculated using standard formulas:
AC = (TC – HDL-C)/HDL-C (2)
VLDL-C = TG/2.2 × 0.45, (mmol/L) (3)
LDL-C = TC – (VLDL-C + HDL-C), (mmol/L) (4)
Serum GAS6 levels were quantified using an enzyme-linked immunosorbent assay (ELISA) with a commercial kit (Cusabio, USA) on a Labline-90 immunoenzymatic analyzer (Austria Lab Technologies). All laboratory tests were performed at the Central Research Laboratory of Kharkiv National Medical University.
Qualitative data are presented as absolute numbers and percentages (n, %). The comparison methods for quantitative data included Student's t-test or Mann-Whitney test; for qualitative data the χ² (Сhi-square) test was used. Statistical data processing was performed using parametric statistics methods with Microsoft Excel 2010 (Licence: Microsoft 365 Subscription 16.104.1 (26010228)). The normality of the distribution of quantitative variables was assessed using the Kolmogorov–Smirnov criterion. All normally distributed data are presented as M±SD (mean ± standard deviation). The comparison of mean values was performed using Fisher's criterion (F). Statistical analysis was performed using Spearman's correlation coefficient to evaluate the relationship between GAS6 and lipid profile parameters. To determine the potential prognostic value of GAS6 and its effectiveness in risk stratification, ROC (Receiver Operating Characteristic) analysis was conducted. The critical level of significance was set at p<0.05 [10].
The study was approved by the Ethics and Bioethics Committee of Kharkiv National Medical University (Protocol No. 2, dated 12.10.2022). All research procedures were conducted in strict accordance with international bioethical standards, including the Declaration of Helsinki and the UNESCO Universal Declaration on Bioethics and Human Rights. All patients provided their voluntary written informed consent to participate in the study.
RESULTS AND DISCUSSION
The evaluation of lipid profile parameters and serum GAS6 concentrations across the study cohorts demonstrated substantial variations. These findings strongly correlate with the progressive decline in patients' metabolic stability. A detailed overview of the metabolic parameter dynamics and GAS6 levels, highlighting the statistical significance of these shifts, is consolidated in Table.
Indicator, Patients with CHF control group CAD+T2DM+ obesity (n=75) CAD+ CAD+obesity (n=50) CAD without BMI, kg/m2 36.70±18.01 24.30±10.25 38.40±9.40 22.60±8.27 23.10±6.74 p1-2 <0.05 p2-3 <0.05 p2-4 >0.05 p2-5 >0.05 p1-3 >0.05 p3-4 <0.05 p3-5 <0.05 p1-4 <0.05 p4-5 >0.05 p1-5 <0.05 TC, mmol/l 6.41±0.69 5.38±0.49 5.42±0.78 5.29±0.64 3.72±0.60 p1-2 <0.05 p2-3 >0.05 p2-4 >0.05 p2-5 <0.001 p1-3 <0.05 p3-4 >0.05 p3-5 <0.001 p1-4 <0.05 p4-5 <0.001 p1-5 <0.001 TG, mmol/l 2.84±0.61 1.81±0.57 1.91±0.64 1.44±0.35 1.31±0.16 p1-2 <0.05 p2-3 >0.05 p2-4 <0.05 p2-5 <0.05 p1-3 <0.05 p3-4 <0.05 p3-5 <0.05 p1-4 <0.05 p4-5 <0.05 p1-5 <0.001 HDL-С, mmol/l 1.15±0.26 1.77±0.28 1.74±0.21 2.47±0.49 2.86±0.27 p1-2 <0.05 p2-3 >0.05 p2-4 <0.05 p2-5 <0.05 p1-3 <0.05 p3-4 <0.05 p3-5 <0.05 p1-4 <0.05 p4-5 <0.05 p1-5 <0.001 LDL-С, mmol/l 4.68±0.43 2.74±0.28 2.94±0.42 2.35±0.28 0.82 ± 0.16 p1-2 <0.001 p2-3 >0.05 p2-4 <0.05 p2-5 <0.001 p1-3 <0.001 p3-4 <0.05 p3-5 <0.001 p1-4 <0.001 p4-5 <0.001 p1-5 <0.001 VLDL-C, mmol/l 0.58±0.43 0.37±0.28 0.39±0.21 0.30±0.28 0.16±0.22 p1-2 <0.05 p2-3 >0.05 p2-4 <0.05 p2-5 <0.05 p1-3 <0.05 p3-4 <0.05 p3-5 <0.05 p1-4 <0.05 p4-5 <0.05 p1-5 <0.001 AC 4.57±0.35 2.04±0.35 2.15±0.49 1.14±0.42 0.51±0.22 p1-2 <0.001 p2-3 >0.05 p2-4 <0.001 p2-5 <0.001 p1-3 <0.001 p3-4 <0.001 p3-5 <0.001 p1-4 <0.001 p4-5 <0.001 p1-5 <0.001 GAS6, ng/ml 31.64±18.71 24.95±10.11 26.98±12.52 23.87±14.50 19.03±7.07 p1-2 ˂ 0.05 p2-3 >0.05 p2-4 >0.05 p2-5 =0.003 p1-3 ˂0.05 p3-4 ˂0.05 p3-5 <0.001 p1-4 ˂0.05 p4-5 <0.05 p1-5 <0.001
units
Measurement
(n=30)
T2DM (n=50)
metabolic pathology (n=50)
The most pronounced disturbances in the blood lipid spectrum were observed in patients of the main group (Group 1), where the combination of CAD with T2DM and obesity led to significant metabolic destabilisation. In particular, the TC level in patients of this group exceeded the control group indicators by 72.3% (p<0.001) and was also significantly higher than the levels in patients with CAD and T2DM by 19.1% and CAD with obesity by 18.3% (p<0.05).
Compared to the Group 4 (with isolated CAD) and the control group, the lipid profile indicators in the main group changed as follows: there was an increase in TG concentrations by almost 2.0 and 2.2 times (p<0.001), LDL-C content by 2.0 and 5.7 times (p<0.001), VLDL-C by 1.93 and 3.6 times (p<0.001), and CA by 4.0 times and 9.0 times, respectively. At the same time, the level of HDL-C was significantly lower by 53.4% compared to patients with isolated CAD and by 59.8% compared to healthy volunteers (p<0.001).
Among patients with CAD and concomitant T2DM (Group 2), a significant increase in TC levels by 44.6% was observed compared to the control group (p<0.001). Compared to patients with isolated CAD and the control group, the indicators changed as follows: TG increased by 25.7% and 38.2% (p<0.05), LDL-C – by 16.6% (p<0.05) and 3.3 times (p<0.001), VLDL-C – by 23.3% (p<0.05) and 2.3 times (p<0.001), and AC – by 78.9% and 4.0 times, respectively, as well as a decrease in HDL-C by 28.3% and 38.1% (p<0.05).
Patients with CHF against the background of CAD and concomitant obesity (Group 3) also showed a significant increase in TG levels by 32.6% and 45.8%, LDL-C – by 25.1% and 3.6 times, VLDL-C – by 30.0% and 2.4 times, and AC – by 88.6% and 4.2 times, as well as a decrease in HDL-C concentration by 29.6% and 39.2% compared to patients with isolated CAD and the control group, respectively (p<0.05).
It should be noted that no lipid profile parameters showed significant changes between patients with CAD and concomitant T2DM and patients with CAD and obesity (p>0.05). These results can be explained by common mechanisms of insulin resistance in both obese patients and patients with T2DM, which is a key mechanism of dyslipidaemia. Systemic inflammation also has a significant impact, affecting lipid metabolism and contributing to the progression of atherosclerosis.
Analysis of serum GAS6 protein levels revealed the greatest increase in patients with combined cardiometabolic pathology (Group 1), where its concentration exceeded that in Groups 2, 3, and 4 by 26.8%, 17.3%, 32.5% (p<0.05) and 66.3% (p<0.001), respectively, compared to Groups 2, 3, 4 and the control group, respectively. The content of this protein in patients with CAD and obesity was significantly higher compared to patients with isolated CAD without metabolic pathology by 13.0% (p<0.05) and the control group by 41.8% (p<0.001). At the same time, no significant differences in GAS6 levels were found between Group 2 and Group 4, as well as between Group 2 and Group 3 (p>0.05). However, the GAS6 level in Group 2 was significantly higher than that in the control group by 31.1% (p=0.003). The data obtained indicate the cumulative effect of combined metabolic conditions on the activation of GAS6 protein, which is a mediator of inflammation and fibrosis.
We examined the correlations between serum GAS6 levels, lipid profile parameters, and BMI in patients with CAD comorbid with T2DM and obesity. For this analysis, the critical value of the Spearman rank correlation coefficient was established at rcrit =0.39 (p<0.05). The resulting correlation matrix is illustrated in Figure 1.
Strong positive correlations were found with BMI (r=0.68; p<0.05), LDL-C (r=0.54; p<0.05) and VLDL-C (r=0.51; p<0.05) and moderate direct correlations with TG (r=0.47; p<0.05), indicating that as serum GAS6 levels increase in this cohort of patients, the most atherogenic lipid metabolism fractions increase proportionally. We also found weak direct correlations with TC (r=0.31; p>0.05), HDL-C (r=-0.26; p>0.05), and AC (r=0.11; p>0.05), which did not reach the level of significance.
When analyzing the data obtained in a group of patients with CAD against the background of concomitant T2DM (Fig. 2), moderate positive correlations were found with LDL-C (r=0.48; p<0.05) and VLDL-C (r=0.52; p<0.05). We also found weak direct correlations with BMI (r=0.31; p>0.05), total cholesterol (r=0.19; p>0.05), HDL cholesterol (r=-0.09; p>0.05), and CA (r=0.24; p>0.05), which did not reach the level of significance.
When analyzing the data obtained in the group of patients with ischemic heart failure against the background of concomitant obesity, reliable positive correlations of moderate strength with BMI (r=0.54; p<0.05), LDL-C (r=0.53; p<0.05) and VLDL-C (r=0.54; p<0.05) and weak correlations with TC (r=0.38; p>0.05), HDL-C (r=-0.24; p>0.05), CA (r=0.31; p>0.05), which did not reach the level of significance. The data are presented in Figure 3.
In the group of patients with CHF and CAD without concomitant metabolic pathology (Fig. 4), significant direct correlations of moderate strength were found with LDL-C (r=0.42; p<0.05) and VLDL-C (r=0.46; p<0.05). Weak direct correlations were also found with BMI (r=0.31; p>0.05), TC (r=0.28; p>0.05), HDL-C (r=-0.14; p>0.05), CA (r=0.24; p>0.05), which did not reach the level of significance.
Values exceeding rcrit=0.39 were considered significant (p<0.05).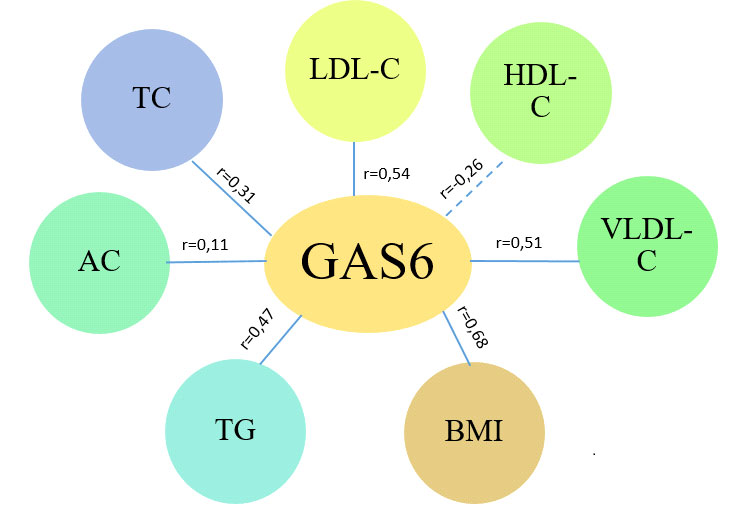
Values exceeding rcrit=0.39 were considered significant (p<0.05).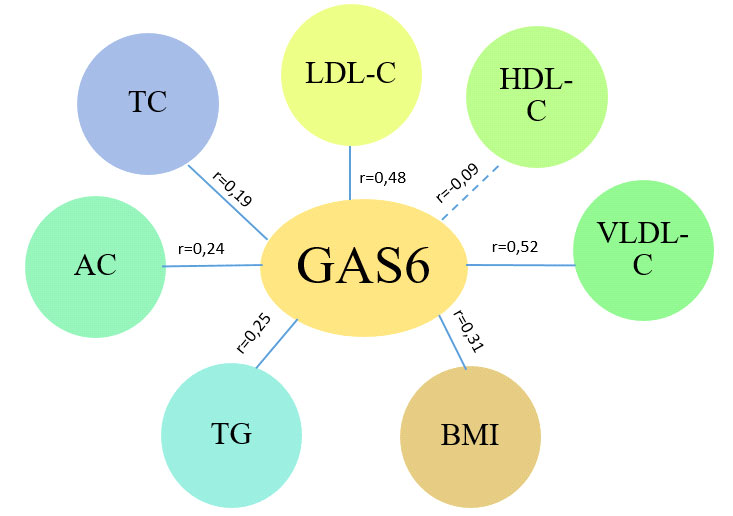
Values exceeding rcrit=0.39 were considered significant (p<0.05)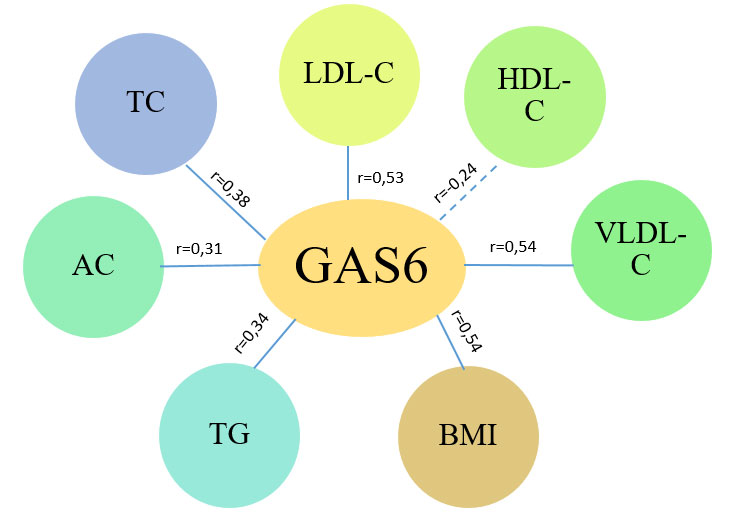
Values exceeding rcrit=0.39 were considered significant (p<0.05)
Thus, the established relationship between elevated GAS6 levels in blood serum and the severity of atherogenic dyslipidaemia confirms that this protein may act as an important biochemical mediator that reflects the degree of metabolic disorders and, presumably, exacerbates the processes of atherosclerosis progression and myocardial remodelling, while the link with BMI indicates that GAS6 protein activation is closely associated with excess body weight and obesity and reflects the severity of metabolic dysfunction directly related to the volume of adipose tissue.
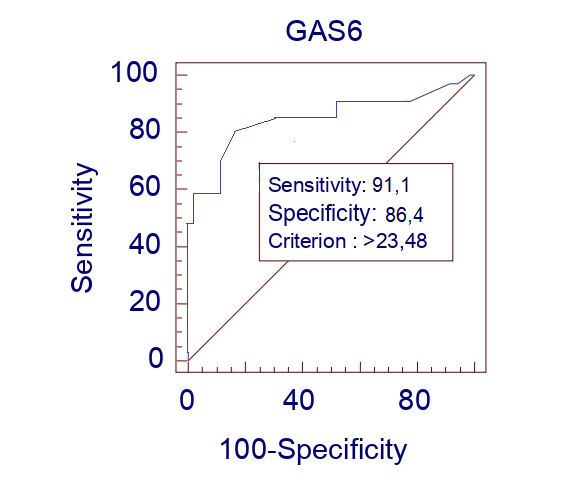
GAS6 protein demonstrated high independent prognostic performance, with a sensitivity of 91.1% and a specificity of 86.4% (data are presented in Fig. 5). This indicator was found to have significant prognostic value on its own and was subsequently included in a mathematical model for predicting the worsening of the functional class of CHF in patients with concomitant metabolic pathology. GAS6 serves as a robust biomarker reflecting the processes of systemic inflammation and myocardial remodeling, providing an optimal balance between the identification of high-risk patients and the minimization of false-positive results.
The results obtained, demonstrating the cumulative effect of comorbid cardiometabolic pathology on the activation of GAS6 protein and its close relationship with atherogenic dyslipidaemia, are consistent with current global trends in the study of the cardiometabolic continuum and the role of vitamin K-dependent proteins in its progression.
Global literature data position GAS6 as a key ligand of the TAM (Tyro3, Axl, MerTK) receptor family, which is a critical mediator in response to inflammation, fibrosis, and cellular homeostasis disorders in the cardiovascular system. In particular, studies by Chen J. et al. [11] and McShane L. et al. [12] confirm that increased expression of the GAS6-Axl signalling pathway plays a central role in myocardial fibrosis and vascular remodelling, especially against the background of metabolic dysfunction. The dominant activation of GAS6 in patients with CAD and concomitant metabolic pathology, as well as a significant increase in its content in the group of patients with only concomitant T2DM or obesity, emphasises that each of these comorbid conditions is an independent and significant stimulus for the activation of GAS6, and their combination leads to the maximum effect. This hypothesis is confirmed by the strong positive correlation between GAS6 and BMI in patients with combined pathology, which directly associates protein activation with the volume of dysfunctional adipose tissue and chronic systemic inflammation characteristic of obesity, as shown in earlier works by Wu K-S et al. [13] and recent studies by Su S-C. et al. [14]. Moreover, the established reliable correlations between GAS6 and proatherogenic fractions of lipid metabolism indicate that GAS6 is not just a marker, but an important signalling protein that reflects the degree of dyslipidaemia and is actively involved in the progression of atherosclerosis. This involvement of GAS6 in the progression of atherosclerosis and plaque instability through its effect on endothelial cells and macrophages is widely covered in the works of Prouse T. et al. [15] and Lutgens E. et al. [16]. Thus, the data obtained allow us to consider GAS6 as an integral prognostic biomarker that reflects the degree of convergence of metabolic and cardiac damage and can be used for more accurate risk stratification in patients with ischemic heart failure against the background of comorbid metabolic conditions.
Prospects for further research. A promising area of current research is the assessment of the prognostic effectiveness of GAS6 in dynamics, namely its ability to predict the development of major cardiovascular events and the progression of chronic heart failure.
CONCLUSIONS
1. Serum GAS6 protein levels exhibit a cumulative growth pattern proportional to the severity of comorbid metabolic disorders, reaching a maximum in patients with combined coronary artery disease, type 2 diabetes mellitus, and obesity (66.3% higher than control; p<0.001). This identifies GAS6 as a key molecular marker of exacerbated inflammation and myocardial remodeling in conditions of triple comorbidity.
2. Significant positive correlations with body mass index (r=0.68; p<0.05), triglyceride levels (r=0.54; p<0.05), and low-density lipoprotein cholesterol (r=0.58; p<0.05) prove that GAS6 activation is a direct reflection of metabolic dysfunction and dyslipidemia severity. This confirms its role in the accelerated progression of atherosclerosis in patients with excess body weight.
3. The presence of either type 2 diabetes mellitus or obesity alone significantly increases GAS6 levels (by 31.1% and 41.8% respectively vs control; p<0.05), characterizing GAS6 as a sensitive diagnostic and prognostic marker for early stratification of cardiac risk in patients with ischaemic-origin chronic heart failure and metabolic disorders.
Contributors:
Borovyk K.M. – methodology, resources, investigation, data curation, writing – original draft;
Kravchun P.G. – conceptualization, writing – review & editing;
Kadykova O.I. – methodology, writing – review & editing;
Babadzhan V.D. – data curation, visualization.
Funding. This research received no external funding.
Conflict of interests. The authors declare no conflict of interest.
REFERENCES
1. Savarese G, Becher PM, Lund LH, Seferovic P, Rosano GMC, Coats AJS. Global burden of heart failure: a comprehensive and updated review of epidemiology. Cardiovasc Res. 2023;118(17):3272-3287. doi: https://doi.org/10.1093/cvr/cvac013
2. Al-Tamimi MA, Gillani SW, Abd Alhakam ME, Sam KG. Factors Associated With Hospital Readmission of Heart Failure Patients. Front Pharmacol. 2021;12:732760. doi: https://doi.org/10.3389/fphar.2021.732760
3. Yao YS, Li TD, Zeng ZH. Mechanisms underlying direct actions of hyperlipidaemia on myocardium: an updated review. Lipids Health Dis. 2020;19(1):23. doi: https://doi.org/10.1186/s12944-019-1171-8
4. Manfioletti G, Brancolini C, Avanzi G, Schneider C. The protein encoded by a growth arrest-specific gene (Gas6) is a new member of the vitamin K-dependent proteins related to protein S, a negative coregulator in the blood coagulation cascade. Mol Cell Biol. 1993;13(8):4976-85. doi: https://doi.org/10.1128/mcb.13.8.4976
5. Rothlin CV, Carrera-Silva EA, Bosurgi L, Ghosh S. TAM receptor signalling in immune homeostasis. Annu Rev Immunol. 2015;33:355-91. doi: https://doi.org/10.1146/annurev-immunol-032414-112103
6. Bellan M, Quaglia M, Nerviani A, et al. Increased plasma levels of Gas6 and its soluble tyrosine kinase receptors Mer and Axl are associated with immunological activity and severity of lupus nephritis. Clin Exp Rheumatol. 2021;39(1):132-38. doi: https://doi.org/10.55563/clinexprheumatol/xyylza
7. Pagani S, Bellan M, Mauro D, et al. New insights into the role of Tyro3, Axl, and Mer receptors in rheumatoid arthritis. Dis Markers. 2020;2020:1614627. doi: https://doi.org/10.1155/2020/1614627
8. Yin Z, Nie X, Li T, et al. Detection of Gas6/AXL complex and its expression changes in patients with ST-segment elevation myocardial infarction. Front Med (Lausanne). 2025;12:1653708. doi: https://doi.org/10.3389/fmed.2025.1653708
9. Shan S, Liu Z, Guo T, et al. Growth arrest-specific gene 6 transfer promotes mesenchymal stem cell survival and cardiac repair under hypoxia and ischaemia via enhanced autocrine signalling and paracrine action. Arch Biochem Biophys. 2018;660:108-20. doi: https://doi.org/10.1016/j.abb.2018.10.016
10. Ivanchuk MA. [Statistical analysis in medical research]. [Internet]. Chernivtsi: Bukovynskyi derzhavnyi medychnyi universytet; 2022 [cited 2025 Mar 20]. 121 p. Ukrainian. Available from: https://dspace.bsmu.edu.ua/bitstream/123456789/19936/1 /456_Ivanchuk.pdf
11. Chen J, Wang Y, Li X, Guo X, Tian J, Zheng X, et al. IDHP Mitigates LPS-Induced Cardiomyocyte Injury via the GAS6/Axl-AMPK Axis: A Multi-Target Strategy Counteracting Inflammation, Oxidative Stress, and Apoptosis. Pharmaceuticals. 2025;18(8):1188. doi: https://doi.org/10.3390/ph18081188
12. McShane L, Tabas I, Lemke G, Kurowska-Stolarska M, Maffia P. TAM receptors in cardiovascular disease. Cardiovasc Res. 2019;115(8):1286-95. doi: https://doi.org/10.1093/cvr/cvz100
13. Wu K-S, Hung Y-J, Lee C-H, Hsiao F-C, Hsieh P-S. The Involvement of GAS6 Signaling in the Development of Obesity and Associated Inflammation. Int J Endocrinol. 2015:2015:202513. doi: https://doi.org/10.1155/2015/202513
14. Su S-C, Chiang C-F, Hsieh C-H, Lu G-H, Liu J-S, Shieh Y-S, et al. Growth arrest-specific 6 modulates adiponectin expression and insulin resistance in adipose tissue. J Diabetes Investig. 2021 Apr;12(4):485-92. doi: https://doi.org/10.1111/jdi.13412
15. Prouse T, Majumder S, Majumder R. Functions of TAM Receptors and Ligands Protein S and Gas6 in Atherosclerosis and Cardiovascular Disease. Int J Mol Sci. 2024;25(23):12736. doi: https://doi.org/10.3390/ijms252312736
16. Lutgens E, Tjwa M, Garcia de Frutos P, Wijnands E, Beckers L, Dahlbäck B, et al. Genetic loss of Gas6 induces plaque stability in experimental atherosclerosis. J Pathol. 2008 Sep;216(1):55-63. doi: https://doi.org/10.1002/path.2381