
 UK
UK  EN
EN 

K.V. Semchenko *1
![]() V.K. Iakovenko2
V.K. Iakovenko2
![]() O.O. Shmalko3
O.O. Shmalko3
![]() S.V. Oliinyk1
S.V. Oliinyk1
![]()
Key words: hard capsules, quality control, Ishikawa diagram, critical parameters, technology
Ключові слова: тверді капсули, контроль якості, діаграма Ішікави, критичні параметри, технологія
Abstract
This article explores the application of the Ishikawa (cause-and-effect) diagram as a risk analysis tool within a pharmaceutical quality system for the production of hard capsules under the code name "Praziquantel Plus". Aligned with the standards of ISO 9001, ICH Q10, and GMP, the study demonstrates how this method systematically identifies and analyzes potential risks across key production categories. The research provides a tailored Ishikawa diagram that facilitates the identification of critical parameters, supports process optimization, and enhances the overall quality assurance system for this specific medicinal product. The aim of the research was to analyze the risks in the production of hard capsules under the conditional name “Praziquantel Plus” using the Ishikawa diagram. The study was based on the analysis of a model industrial process for the production of Praziquantel Plus hard capsules. The materials for the risk analysis were the technological regulations, specifications for raw materials and finished product, as well as the requirements of GMP/ICH standards. The study employed a systematic approach to risk assessment in accordance with ICH Q9 guidelines. The primary methodology is centered on the construction of the Ishikawa diagram. The study is based on a systems approach, brainstorming, cluster analysis and cause-and-effect analysis. A comprehensive Ishikawa diagram was developed, structured around six primary risk categories for pharmaceutical production: raw materials, production process, equipment, personnel, premises, and quality control. Critical risk factors were identified and prioritized. The most significant risks were found to be associated with: a) the quality of active pharmaceutical ingredients and excipients (e.g., inconsistency in quantitative content, impurities); b) critical stages of the technological process (e.g., weighing accuracy, mixture homogeneity, capsule filling flowability); and c) the specifics of pharmaceutical equipment qualification and operation. Detailed risk assessment tables were created for both raw materials and the technological process, outlining potential failures, their consequences, and proposed precautionary measures to mitigate each risk (e.g., enhanced incoming quality control, process validation, equipment calibration). An adapted, product-specific Ishikawa diagram was proposed for the industrial-scale production of “Praziquantel Plus”. This diagram details first- and second-order subcategories within the main "bones," reflecting the unique aspects of scaling up from laboratory to commercial manufacturing. The Ishikawa diagram method proves to be an effective and structured tool for pre-emptive risk identification in pharmaceutical process development and scale-up, aligning with GMP and ICH Q9/Q10 requirements. The study successfully mapped and systematized the key risk categories and their interrelations for the production of “Praziquantel Plus” hard capsules, providing a visual and analytical framework for quality management. The proposed tailored diagram and risk tables serve as a practical foundation for implementing preventive actions, optimizing the technological process, and conducting root-cause analysis of potential defects, thereby strengthening the overall Pharmaceutical Quality System for this product.
Реферат
Аналіз ризиків у виробництві твердих капсул під умовною назвою «Празиквантел плюс» методом діаграми Ішікави. Семченко К.В., Яковенко В.К., Шмалько О.О., Олійник С.В. У цій статті досліджується застосування діаграми Ішікави як інструменту аналізу ризиків у фармацевтичній системі якості для виробництва твердих капсул під умовною назвою «Празиквантел Плюс». Відповідно до стандартів ISO 9001, ICH Q10 та GMP, показано, як цей метод систематично виявляє та аналізує потенційні ризики в ключових категоріях виробництва. Запропоновано адаптовану діаграму Ішікави, яка полегшує ідентифікацію критичних параметрів, підтримує оптимізацію процесів та покращує загальну систему забезпечення якості для цього конкретного лікарського засобу. Мета цього дослідження полягала в аналізі ризиків у виробництві твердих капсул під умовною назвою «Празиквантел Плюс» за допомогою діаграми Ішікави. Дослідження ґрунтувалося на аналізі модельного промислового процесу виробництва твердих капсул «Празиквантел Плюс». Матеріалами для ризик-аналізу слугували технологічний регламент, специфікації на сировину та готовий продукт, а також вимоги стандартів GMP/ICH. У дослідженні було використано систематичний підхід до оцінювання ризиків відповідно до рекомендацій ICH Q9. Основна методологія зосереджена на побудові діаграми Ішікави. Дослідження базується на системному підході, мозковому штурмі, кластерному аналізі та причинно-наслідковому аналізі. Розроблено комплексну діаграму Ішікави, структуровану навколо шести основних категорій ризику для фармацевтичного виробництва: сировина, виробничий процес, обладнання, персонал, приміщення та контроль якості. Ідентифіковано та пріоритизовано критичні фактори ризику. Найбільш значущими виявилися ризики, пов'язані з: а) якістю АФІ та допоміжних речовин (напр., невідповідність кількісного вмісту, домішки); б) критичними етапами технологічного процесу (напр., точність зважування, однорідність суміші, сипкість маси при заповненні капсул); в) специфікою кваліфікації та експлуатації фармацевтичного обладнання. Створено детальні таблиці оцінки ризиків як для сировини, так і для технологічного процесу, де описані потенційні відмови, їх наслідки та запропоновані превентивні заходи для зменшення кожного ризику (напр., посилений вхідний контроль якості, валідація процесу, калібрування обладнання). Запропоновано адаптовану, продукт-специфічну діаграму Ішікави для промислового виробництва «Празиквантел Плюс». Ця діаграма деталізує підкатегорії першого та другого рівня в межах основних «кісток», що відображає особливості масштабування технології з лабораторного рівня на виробничий. Метод діаграми Ішікави зарекомендував себе як ефективний та структурований інструмент для превентивної ідентифікації ризиків при фармацевтичній розробці та масштабуванні процесів, що відповідає вимогам GMP та ICH Q9/Q10. Дослідження успішно систематизувало ключові категорії ризиків та їх взаємозв'язки для виробництва твердих капсул «Празиквантел Плюс», надавши візуальну та аналітичну основу для управління якістю. Запропоновані спеціалізована діаграма та таблиці ризиків слугують практичною основою для впровадження профілактичних дій, оптимізації технологічного процесу та аналізу основних причин потенційних дефектів, тим самим посилюючи загальну Фармацевтичну систему якості для цього препарату.
A Pharmaceutical Quality System (PQS) is a set of processes and procedures aimed at ensuring that pharmaceutical products are produced, stored and distributed in accordance with established quality standards. The basis of PQS is the international quality management system ISO 9001 and the requirements set out in the ICH Q10 guidelines. The system provides:
- Document management;
- Process and equipment validation and qualification;
- Change management;
- Internal audits;
- Deviation control and management.
Quality of pharmaceutical products in Ukraine are regulated mainly by the requirements of State Pharmacopoeia of Ukraine, guidelines and the numerous orders of the Ministry of Health of Ukraine (MOHU) [1, 2, 3].
Risk analysis is a key component of PQS, which helps to minimize potential threats to product quality and patients. It is based on the principles outlined in the ICH Q9 guideline (“Quality Risk Management”). The main steps of risk analysis are risk identification, risk assessment, risk mitigation, risk monitoring and risk control.
Various methods are used to manage risks:
- FMEA (Failure Modes and Effects Analysis) – analysis of potential failure modes and their consequences.
- FTA (Fault Tree Analysis) – a method of constructing a “fault tree” to identify the causes of problems.
- HACCP (Hazard Analysis and Critical Control Points) – risk analysis to identify critical points in production processes.
- Pareto Analysis – a method for identifying major problems based on the “80/20” principle.
- Ishikawa Diagram (Fishbone Diagram) – analysis of the causes of problems from various aspects (people, processes, equipment).
The Ishikawa diagram is an effective analytical tool for ensuring the quality of medicinal products. The main purpose of this method is to systematically identify and classify probable problems or causes of their occurrence in the production process. The use of the method is due to the complexity of the production of pharmaceutical products, when a combination of factors, such as the quality of incoming raw materials, equipment, technological methods, personnel, premises, etc., that can affect the quality of products both directly and indirectly.
The Ishikawa diagram gives the opportunity to structure the analysis process by highlighting the main categories of factors that can affect the quality of the medicinal product. This provides a comprehensive approach to solving problems, eliminating chaos in the search for causes. By detailing each category of factors, the root causes that lead to product defects, for example, uneven dosing of APIs in dosed preparations, can be identified. Usage of the diagram allows us to predict possible risks and create preventive measures aimed at improving production processes. This method admits enterprises to comply with high quality standards, such as the international Good Manufacturing Practice (GMP) standards and the international quality management system (ISO), ensuring quality control at all stages of production.
In scientific activities, the Ishikawa diagram construction method gives the opportunity to assess possible risks when scaling a laboratory technological process to a production one, establish possible critical parameters of the production process, and identify risks when developing quality control methods for medicinal products [4-8].
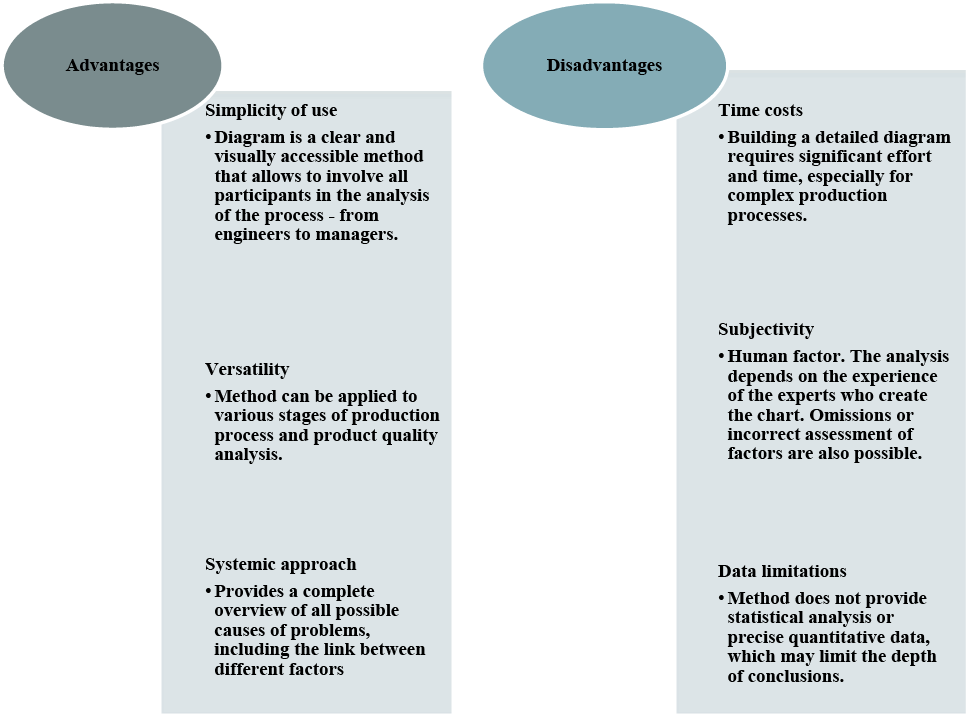
The Ishikawa diagram is an indispensable tool in pharmaceutical production, its usage contributes to the improvement of production processes, raising quality standards and preventing risks [9, 10]. However, it is important to consider the disadvantages of this method when combining it with other analytical tools for a deeper and more accurate analysis. The advantages and disadvantages of the Ishikawa diagram method are shown in Figure 1.
The purpose of this study was to analyze the risks in the production of hard capsules under the conditional name “Praziquantel Plus” using the Ishikawa diagram.
MATERIALS AND METHODS OF RESEARCH
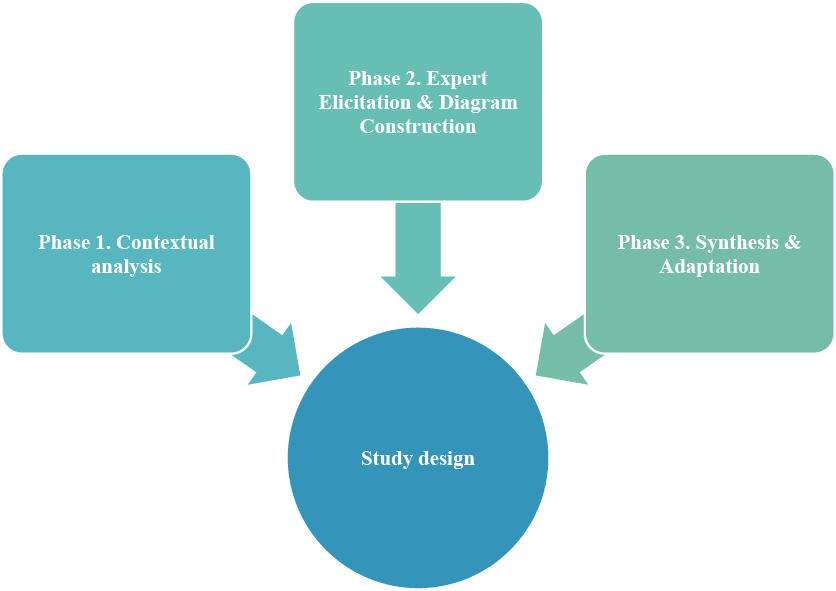
This research follows a qualitative, descriptive study design structured into three consecutive phases to ensure a systematic approach to risk identification and analysis (Fig. 2).
Phase 1: Contextual Analysis. A comprehensive review of the technological documentation for “Praziquantel Plus” capsules and relevant quality standards (GMP, ICH Q9, Q10) was conducted to define the scope and framework for risk assessment.
Phase 2: Expert Elicitation & Diagram Construction. The core analytical phase involved a structured brainstorming session with an expert panel (n=5) comprising pharmaceutical technologists, quality assurance, and production specialists. The elicited potential failure causes were then organized using cause-and-effect analysis and cluster analysis to construct a general Ishikawa diagram.
Phase 3: Synthesis & Adaptation. Based on the general diagram and a detailed process breakdown, a product-specific Ishikawa diagram for industrial-scale production was developed. Identified risks were further detailed and mitigation measures were proposed in tabular form.
Primary Analytical Tool. The Ishikawa (fishbone) diagram served as the primary visual and analytical tool throughout Phases 2 and 3 to structure and present the cause-and-effect relationships.
The basis for the study was the theoretical and information array necessary for modeling the risk analysis process. The materials of the study were a model technological process for the industrial production of hard capsules with combined content (code name “Praziquantel Plus”); a list of potential critical control points and quality parameters, identified based on the requirements of the State Pharmacopoeia of Ukraine, GMP and similar technologies; and categories of risk factors generally recognized in the pharmaceutical industry.
The study employed a systematic approach to risk assessment in accordance with ICH Q9 guidelines [2]. The primary qualitative methodology centered on the construction of an Ishikawa diagram. The process involved the following steps:
- Brainstorming session with a moderated expert group (technologists, QA/QC specialists, engineers) to generate a comprehensive list of potential failure causes.
- Content analysis and clustering of the generated ideas into predefined main categories (raw materials, equipment, personnel, premises, technological process, quality control).
- Cause-and-effect analysis to logically link the clustered causes to the potential effect (“Poor quality of Praziquantel Plus capsules”).
- Expert consensus method was used to review, refine, and finalize the structure of the diagram [2, 4, 6].
For risk prioritization, experts assessed each identified cause based on its estimated probability of occurrence and severity of impact on critical quality attributes. This qualitative assessment allowed for the identification of the most critical parameters requiring control measures, as presented in Tables 1 and 2.
For risk prioritization, a semi-quantitative approach based on the Risk Priority Number (RPN) was employed, in accordance with the principles of ICH Q9. Following the brainstorming session and construction of the general Ishikawa diagram, the expert panel (n=5) assessed each identified potential cause of failure.
Each risk was evaluated using two parameters:
Probability (P): The likelihood of the risk occurring.
Severity (S): The seriousness of the potential impact on the critical quality attributes (CQAs) of “Praziquantel Plus” capsules and patient safety.
Both parameters were scored on a 3-point ordinal scale (1=Low, 2=Medium, 3=High). The consensus scores were then multiplied to calculate the Risk Priority Number (RPN=P×S), which could range from 1 to 9.
Based on the RPN value, risks were prioritized for further analysis and mitigation:
High-priority (RPN≥6): Risks requiring immediate preventive actions and detailed control strategies (e.g., in-process controls, validation).
Medium-priority (RPN 3-4): Risks requiring monitoring and standard quality control procedures.
Low-priority (RPN 1-2): Acceptable risks under current control measures.
This prioritization enabled the research team to focus the subsequent detailed analysis on the “Raw Materials” and “Technological Process” categories, which contained over 70% of all high-priority risks.
Given the qualitative nature of the study and the use of expert elicitation data, formal statistical software was not employed for hypothesis testing. The semi-quantitative RPN calculation was performed using Microsoft Excel 365. Data organization and diagram structuring were supported by standard features of the software.
This study involved a structured expert elicitation session (brainstorming) as part of the risk analysis methodology. Participation was voluntary, and all experts provided informed verbal consent after being briefed on the study’s purpose and the anonymous, aggregated use of their input for academic publication. No personal or sensitive data were collected. The research procedure, focusing on process analysis rather than human subjects, was conducted in accordance with the ethical principles for non-interventional studies. Formal review by an institutional ethics committee was not required for this type of methodological research, as confirmed by the internal regulations of the National University of Pharmacy.
RESULTS AND DISCUSSION
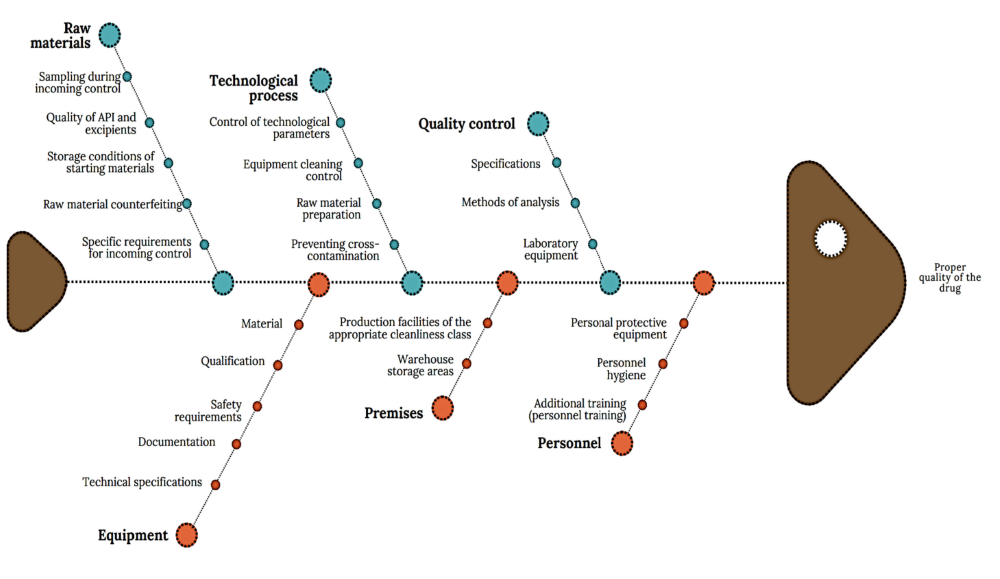
The general Ishikawa diagram, which allows taking into account the multilevel nature of factors affecting the quality of a drug as a final product and establishing key links between them, is shown in Figure 3. This diagram is based on the requirements of current legislation, WHO recommendations and national standards [11, 12].
According to the diagram (Fig. 3), the main risk factors of drug production include the quality of raw materials, technological process, quality control, premises, equipment, personnel, which are detailed by level 2 factors. Among the listed main factors, it is possible to distinguish factors of the first and second order in terms of significance, establish their links and group them.
1. Risk Prioritization and Justification of Focus
To move from a mere listing of factors to a justified conclusion about their criticality, a semi-quantitative risk assessment was performed. An expert panel (n=5) scored each identified cause from the general diagram (Fig. 3) on scales of Probability (P) and Severity (S) as described in the Methods. The calculated Risk Priority Number (RPN) served as a quantitative filter. The distribution of high-priority risks (RPN ≥6) across categories is presented in Fig. 3. As evidenced, the “Raw Materials” and “Technological Process” categories contained over 70% of all high-priority risks. This objective data directly supports our decision to focus the subsequent detailed analysis precisely on these areas, as presented in Tables 1 and 2 and in the adapted diagram (Fig. 4).
2. Detailed Analysis of High-Priority Risks
Following the prioritization, the most critical risks were analyzed in depth considering the peculiarities of production processes and the influence of factors on the quality of the finished drug, they can be divided into specific and general. Specific factors include the quality of the raw materials, quality control of the raw materials, intermediate and finished products, and the technological process. It is these factors that were subjected to the most thorough analysis during our study.
Of course, the main influence on the quality of the future drug is the quality of the raw material. Its quality risks are characterized by several secondary factors, illustrated in the diagram.
During the quality control of the finished drug, the choice of the API/excipient and the development of a method for its qualitative and quantitative determination, as well as the assessment of the microbiological state, are of great importance. All specification parameters are developed in accordance with the general guidance on finished drugs.
When conducting stability tests for drugs with several APIs, the possible mutual influence on the process of qualitative and quantitative determination of substances should be considered. Validation of the methods used is an urgent and mandatory task in the development of the MCQ.
Factors such as premises and personnel have an unconditional impact on ensuring the quality of medicinal products. However, given the standardized requirements for both personnel and premises set out in the licensing conditions, we decided to specify only specific requirements for these factors. The main research was devoted to the input raw materials, technological process, quality control and equipment, which are decisive in the process of pharmaceutical development and introduction of new original medicinal products.
Production premises should follow a logical sequence of the production process. For both APIs and excipients, temperature and humidity control, filtration and effective ventilation are of great importance. Weighing of raw materials should be carried out in a separated from the production process premise. The design of the premises should facilitate compliance with special measures to prevent cross-contamination and facilitate cleaning when dust is generated (sampling, weighing, grinding, mixing, sieving and other operations). Warehouses should have sufficient capacity for orderly storage of different categories of raw materials. Containers should be placed in such a way as to ensure free air circulation. The storage area should provide protection of materials from weather conditions and control of proper storage conditions. Warehouses should have separate areas: for quarantined materials, approved materials and rejected starting materials.
Production personnel and quality control personnel must have special training. The authorized person must have specific knowledge of the processing and quality control of materials in the production of film-coated tablets. Strict adherence to hygiene requirements by personnel during the production process prevents further contamination of raw materials, intermediate products and finished products. Production personnel who are in direct contact with raw materials must be provided with personal protective equipment: masks, gloves, glasses. Persons with allergic diseases or predisposition to them are not allowed to work with raw materials.
Pharmaceutical equipment used must meet the requirements of good manufacturing practice. The operational characteristics of the equipment must ensure the performance of the production task within the operating load range. The technical characteristics of the equipment must correspond to the planned range and volumes of product output. The material of the equipment must not interact with the raw materials or products, serve as a source of contamination of the intermediate and finished product.
Qualification of critical equipment, process validation and change control ensure the reproducibility of the production process, thereby guaranteeing consistent quality and efficacy of different batches of the drug produced.
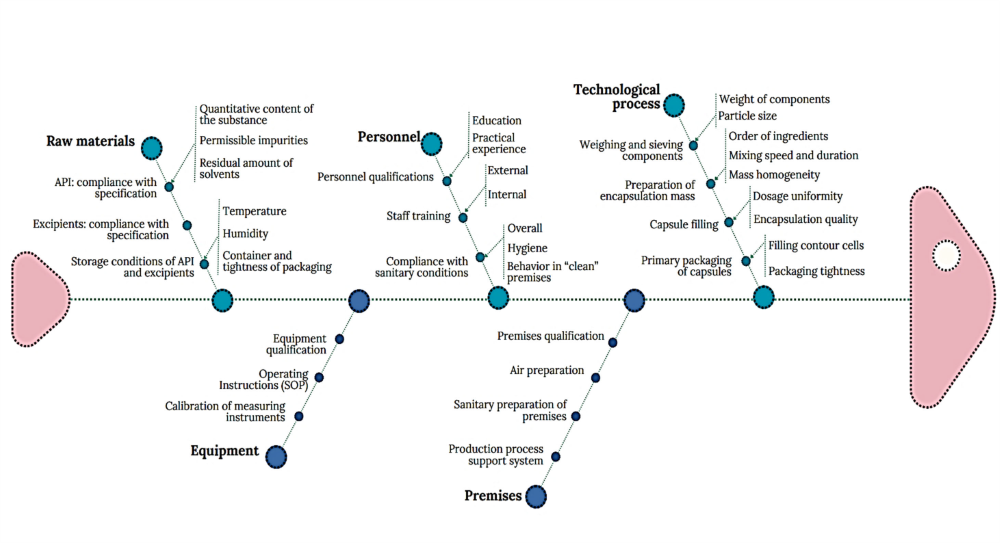
In order to minimize the potential risks of industrial production of hard capsules under the conditional name “Praziquantel Plus” when extrapolating laboratory technology, their analysis was conducted.
The main categories defined are raw materials, production process, equipment, personnel and premises. Particular attention was paid to potential risks associated with APIs and excipients (Table 1) and with the technological process (Table 2).
Taking into account the peculiarities of adapting laboratory technology to industrial conditions for the production of hard capsules under the conditional name “Praziquantel Plus”, the Ishikawa diagram focused on the peculiarities of the production process of this particular drug was constructed (Fig. 4). The categories “Raw materials”, “Technological process” and “Personnel” contain subcategories of the first and second order, maximally corresponding to the peculiarities of the production process of this drug.
The proposed Ishikawa diagram for hard capsules under the conditional name “Praziquantel Plus” can be used in the future in the following situations:
1. Analysis of the causes of product defects. If there is a problem with the quality of the capsules being produced (for example, capsules with uneven dosage), the diagram will help identify possible sources of the problem.
2. Quality control. The diagram will help to adjust the various stages of the production process to avoid defects at all stages of production.
3. Process optimization. Analyzing all possible causes of failures or costs during production allows to increase efficiency and reduce costs.
The general cause-and-effect diagram constructed for our study identified six primary categories: Raw Materials, Technological Process, Quality Control, Premises, Equipment, and Personnel. This categorization is a direct operationalization of the integrated approach required by a PQS, as described in the ICH Q10 guideline. Furthermore, our systematic approach to risk identification, assessment, and control is fundamentally based on the principles of ICH Q9 (Quality Risk Management). While ICH Q9 provides the high-level framework, our study demonstrates its practical implementation by selecting an appropriate tool (Ishikawa diagram) for a specific, defined scope – the scale-up of a capsule product.
Our identification of raw material quality as a first-order risk factor (Table 1) is a universally acknowledged principle in Good Manufacturing Practice (GMP). The WHO in its GMP guidelines explicitly states that the quality of a finished product depends heavily on the quality of the starting materials.
Our detailed breakdown of the technological process resonates strongly with the findings of other researchers who have applied risk management to solid dosage forms. For instance, a review by Yu et al. (2014) [13] on the application of Quality by Design (QbD) to solid oral dosage forms identifies “blend uniformity” and “powder flow properties” as critical process parameters for capsule filling and tablet compression, which are directly related to our identified risks of “Heterogeneity of the encapsulation mass” and “Poor flowability of the mixture”. While Yu et al. approached this from a QbD perspective, our use of the Ishikawa diagram arrived at the same critical parameters, demonstrating the tool’s effectiveness in pinpointing areas that require rigorous control.
Similarly, the risk we identified concerning the “Weighing and Sieving” stage, particularly, inaccuracy in weighing, is highlighted in GMP literature as a common source of error. The PIC/S GMP Guide dedicates an entire annex to the Guidance on Good Manufacturing Practice for Medicinal Products, where it emphasizes that weighing, measuring, and other equipment used for critical steps should be calibrated and checked at defined intervals (5, Annex 4) [14].
Our analysis of the “Personnel” and “Premises” categories, while noting their standardized requirements, specified risks such as the need for personnel with special training and the exclusion of individuals with allergic predispositions. This aligns with the human factor engineering concepts increasingly integrated into GMP. The FDA's guidance on quality systems approaches emphasizes that as management should ensure that personnel have the education, training, and experience, or any combination thereof, to perform their assigned functions [15]. Our inclusion of a specific health screening (allergies) adds a nuanced, product-specific layer to this general personnel requirement, a detail that is often crucial in practice but may be absent from high-level guidelines.
Regarding “Premises”, our emphasis on a logical flow, separate weighing areas, and controlled warehouses to prevent contamination and mix-ups is a cornerstone of GMP facility design, as outlined by ISPE in its Baseline Guide: Oral Solid Dosage Forms [16]. Our use of the Ishikawa diagram effectively integrates these infrastructural and design requirements into the same risk assessment framework as the process parameters, promoting a holistic view of quality that is essential for successful pharmaceutical production.
Today, the pharmaceutical industry, following the automotive industry (AIAG-VDA FMEA Handbook 2019), often moves away from simple RPN multiplication in favor of Action Priority tables that take into account various combinations of S, O, D without arithmetic manipulations.
CONCLUSIONS
- The integration of qualitative risk analysis methods (brainstorming, clustering) with a semi-quantitative prioritization tool (probability/severity scoring) enabled a systematic identification and ranking of potential failure modes for the “Praziquantel Plus” hard capsules technology. This confirms the Ishikawa diagram’s efficacy as a structured tool within a Pharmaceutical Quality System compliant with ICH Q9.
- The risk prioritization results unequivocally identified factors related to input material quality (specifically, API content and impurity levels) and the control of critical process steps (weighing, blend homogeneity, powder flowability) as being paramount for final product quality. These categories contained the highest concentration of high-priority risks (RPN≥6), justifying the focused analysis presented in this study.
- The developed product-specific Ishikawa diagram (Fig. 4), supplemented by detailed risk mitigation tables (Tables1, 2), provides a ready-to-implement toolkit for production. It is designed for proactive quality control, root-cause analysis of defects, and process optimization during technology scale-up, thereby directly enhancing GMP compliance and reducing the cost of non-conformance.
Contributors:
Semchenko K.V. – writing – original draft, supervision;
Iakovenko V.K. – methodology, writing – review and editing;
Shmalko O.O. – conceptualization, methodology – review and editing;
Oliinyk S.V. – conceptualization, writing – review and editing.
Funding. The research was conducted under the financing from the funds of National University of Pharmacy at the topic ща initiative direction “Development of composition, technology and biopharmaceutical research of medicines based on natural and synthetic raw materials” (state registration number: 0114U000945).
Conflict of interests. The authors declare that they have no conflict of interest in relation to this research, whether financial, personal, authorship or otherwise, that could affect the research and its results presented in this paper.
REFERENCES
- [State Pharmacopoeia of Ukraine: in 3 vol. 2nd ed]. Kharkiv: Ukrainian Scientific Pharmacopoeial Center for Quality of Medicinal Products; [Internet]. 2014 [cited 2025 Nov 23].Available from: https://sphu.org/wp-content/uploads/2026/03/content_2t_2izd.pdf
- [Medicinal products. Pharmaceutical development (ICH Q8): guideline ST-N MOZU 42-3.0:2011. Effective from 2011 Dec 28]. [Internet]. 2011 [cited 2025 Nov 23]. Ukrainian.Available from: https://compendium.com.ua/uk/clinical-guidelines-uk/standartizatsiya-farmatsevtichnoyi-produktsiyi-tom-1/st-n-mozu-42-3-0-2011/
- [Requirements for the manufacture of non-sterile medicinal products in a pharmacy: guideline ST-N MOZU 42-4.5:2015. Effective from 2015 Dec 28]. [Internet]. 2015 [cited2025 Nov 23]. Available from: https://atl.nuph.edu.ua/wp-content/uploads/2022/09/vimogi-do-vigotovlennja-nesterilnih-likarskih-zasobiv-umovah-aptek.pdf
- Kumah A, Nwogu CN, Issah AR, Obot E, Kanamitie DT, Sifa JS, et al. Cause-and-Effect (Fishbone) Diagram: A Tool for Generating and Organizing Quality Improvement Ideas. Glob J Qual Saf Healthc. 2024;7(2):85-7. doi: https://doi.org/10.36401/JQSH-23-42
- Savchenko L, Pidpruzhnykov Y, Ivanauskas L, Lukošius A, Georgiyants V. Risk assessment for compounding ointments quality by Ishikawa diagram construction.2021;69(4):688-96. doi: https://doi.org/10.31925/farmacia.2021.4.8
- Tagaram SD, Chen C. Quality tools and techniques (Fishbone Diagram, Pareto Chart, Process Map). In: StatPearls. Treasure Island (FL): StatPearls Publishing; [Internet]. 2024 [cited 2025 Nov 23]. Available from: https://www.ncbi.nlm.nih.gov/books/NBK607994/
- Almakaiev MS, Bashura OH, Sidenko LM. [Risk assessment at the stage of pharmaceutical development of a combined drug in the form of capsules]. Visnyk Farmatsii.2021;2:75-84. doi: https://doi.org/10.24959/nphj.21.54
- Semenova KM, Almakaieva LH. [Substantiation of the target quality profile and risk assessment for the development of a combined drug for injections]. Visnyk Farmatsii.2022;1:79-85. doi: https://doi.org/10.24959/nphj.22.89
- Alqahtani MS, Kazi M, Alsenaidy MA, Ahmad MZ. Advances in Oral Drug Delivery. Front Pharmacol. 2021;12:618411. doi: https://doi.org/10.3389/fphar.2021.618411
- Atre P, Rizvi SAA. Advances in Oral Solid Drug Delivery Systems: Quality by Design Approach in Development of Controlled Release Tablets. BioChem. 2025;5(2):9. doi: https://doi.org/10.3390/biochem5020009
- Ding L, Brunaugh AD, Stegemann S, Jermain SV, Herpin MJ, Kalafat J, et al. A Quality by Design Framework for Capsule-Based Dry Powder Inhalers. Pharmaceutics.2021;13(8):1213. doi: https://doi.org/10.3390/pharmaceutics13081213
- Duarte JG, Duarte MG, Piedade AP, Duarte DR. Rethinking Pharmaceutical Industry with Quality by Design: Application in Research, Development, Manufacturing, and Quality Assurance. AAPS J. 2025;27(4):96. doi: https://doi.org/10.1208/s12248-025-01079-w
- Yu LX, Amidon G, Khan MA. Understanding Pharmaceutical Quality by Design. The AAPS Journal. 2014;16(4):771-83.
doi: https://doi.org/10.1208/s12248-014-9598-3 - Guide to good manufacturing practice for medicinal products. Pharmaceutical inspection co-operation scheme (PIC/S). Geneva: PIC/S; 2022. 393 p.
- Guidance for industry: Quality systems approach to pharmaceutical CGMP regulations. U.S. food and drug administration (FDA). Silver Spring: FDA; [Internet]. 2006 [cited 2025 Nov 23]. 32 p. Available from: https://www.fda.gov/media/71023/download
- Oral solid dosage forms. Baseline guide. International society for pharmaceutical engineering (ISPE). 3rd ed. North Bethesda: ISPE; 2018. 210 p.